Unlock a world of possibilities! Login now and discover the exclusive benefits awaiting you.
- Qlik Community
- :
- Discover
- :
- About
- :
- Water Cooler
- :
- Re: Same Sum, disregards dimensions in a chart, ex...
- Subscribe to RSS Feed
- Mark Topic as New
- Mark Topic as Read
- Float this Topic for Current User
- Bookmark
- Subscribe
- Mute
- Printer Friendly Page
- Mark as New
- Bookmark
- Subscribe
- Mute
- Subscribe to RSS Feed
- Permalink
- Report Inappropriate Content
Same Sum, disregards dimensions in a chart, except one
Hi all,
I'm trying to get KPIs of my customer service, which i control every customers request as a CASE. I'm basically extracting data from Microsoft Dynamics CRM, which i have all my CASES, and analyzing them in QV. I need to know the average time my employees are executing services, then compare this average per service and per case.
I already know the average of time of every service (picture 1), but when i'm trying to drilldown and compare this average per case and per employee, the average changes in the chart, like picture 2.
I basically want to check if cases were solved according the average like picture 3. So, for all cases, the average must be the same as the value of picture 1.
To calculate the average i'm using expression:
sum(ceil((Aggr(sum([Case Spent Time]),[Service]))/
(aggr(COUNT(DISTINCT{$<{[Case Status] = {'solved'}>}[Case Number]),[Service]))))
I've already tried without the first sum, but instead 0 i got null. Also tried with aggr fuction, but didn't work as well.
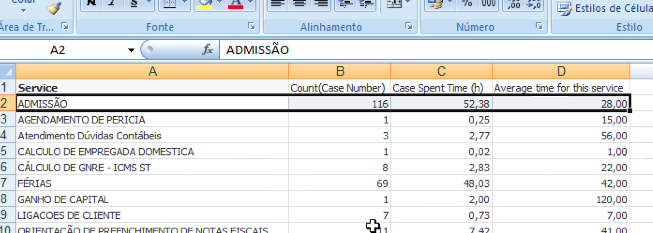
picture 1
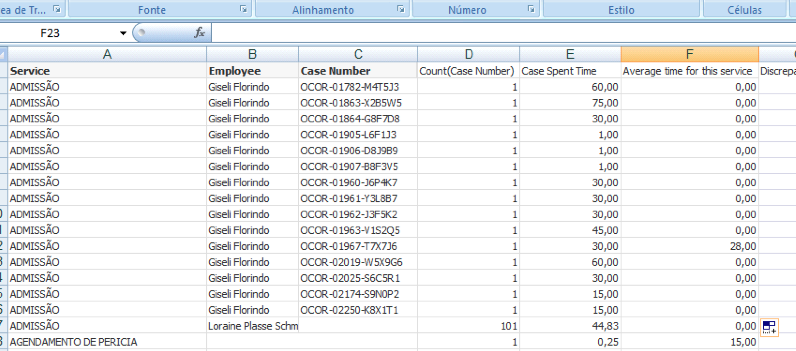
picture 2
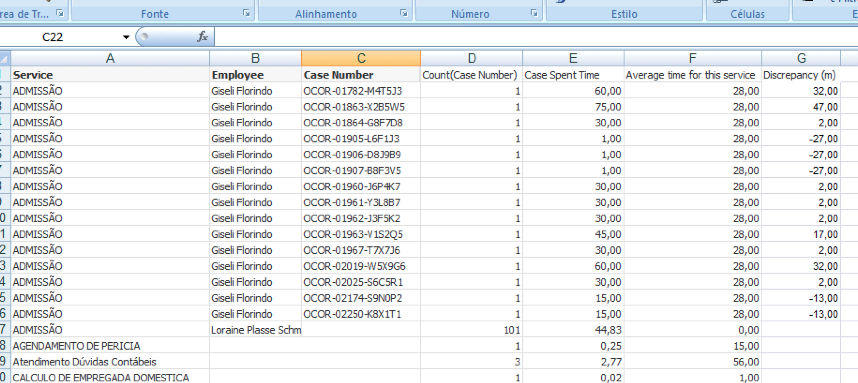
picture 3
Will be very glad if someone could help me, it's driving me crazy.
Best regards
- Mark as New
- Bookmark
- Subscribe
- Mute
- Subscribe to RSS Feed
- Permalink
- Report Inappropriate Content
Hello Rodrigo,
Instead of the aggr() function use the total function to calculate the average time for the service and then the discrepancy. For example,
sum(total <Service> [Case Spent Time])/count(distinct total <Service> {$<{[Case Status] = {'solved'}>} [Case Number])
Regards, Karl
- Mark as New
- Bookmark
- Subscribe
- Mute
- Subscribe to RSS Feed
- Permalink
- Report Inappropriate Content
Karl,
When you said <Service> what does it means? Use only SERVICE dimension, or dimentios between < > symbols?
By the way, i have used dimension plus < >, as <Service>, and i dind't work.
Thanks.
- Mark as New
- Bookmark
- Subscribe
- Mute
- Subscribe to RSS Feed
- Permalink
- Report Inappropriate Content
Use the service field within < >. When you said it doesn't work, do you mean that no value is returned or the value is incorrect? Please include the formula you are using.
Regards, Karl
- Mark as New
- Bookmark
- Subscribe
- Mute
- Subscribe to RSS Feed
- Permalink
- Report Inappropriate Content
Karl,
Not working mean there are no values.
sum(TOTAL <SERVICO_OCORRENCIA> TEMPO_GASTO_OCORRENCIA)/Count(DISTINCT TOTAL <SERVICO_OCORRENCIA> {$<STATUS_OCORRENCIA={'Resolvido'}>} NUMER_OCORRENCIA)
I'm developing in portuguese, so here are translations:
SERVICO_OCORRENCIA - Service
TEMPO_GASTO_OCORRENCIA - [Case Spent Time]
STATUS_OCORRENCIA - [Case Status]
Resolvido - solved
NUMER_OCORRENCIA - [Case Number]
- Mark as New
- Bookmark
- Subscribe
- Mute
- Subscribe to RSS Feed
- Permalink
- Report Inappropriate Content
Hi Rodrigo,
The formula looks good. If you're still having a problem, try to divide and test each part of the formula. First try
sum(TOTAL <SERVICO_OCORRENCIA> TEMPO_GASTO_OCORRENCIA)
and then,
Count(DISTINCT TOTAL <SERVICO_OCORRENCIA> {$<STATUS_OCORRENCIA={'Resolvido'}>} NUMER_OCORRENCIA)
Uploading a sample file might help, too.
Karl