Unlock a world of possibilities! Login now and discover the exclusive benefits awaiting you.
- Qlik Community
- :
- All Forums
- :
- QlikView App Dev
- :
- Chart legend (X axis) to be in a direct timeline
Options
- Subscribe to RSS Feed
- Mark Topic as New
- Mark Topic as Read
- Float this Topic for Current User
- Bookmark
- Subscribe
- Mute
- Printer Friendly Page
Turn on suggestions
Auto-suggest helps you quickly narrow down your search results by suggesting possible matches as you type.
Showing results for
Not applicable
2013-09-17
10:16 AM
- Mark as New
- Bookmark
- Subscribe
- Mute
- Subscribe to RSS Feed
- Permalink
- Report Inappropriate Content
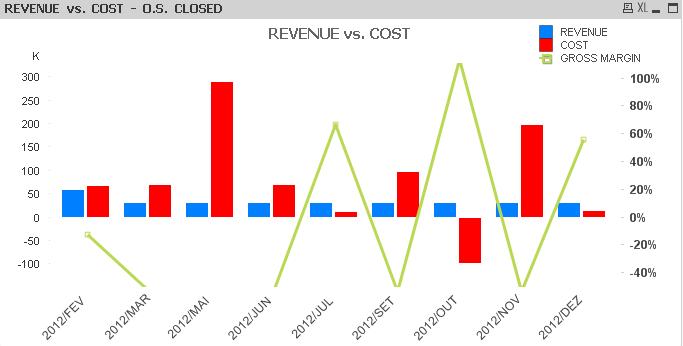
Chart legend (X axis) to be in a direct timeline
I want the chart legend (X axis) to be in a direct timeline
I also want the blank months to appear.
Example:
Dimension
=IF(REGION_COST=REGIAO_REVENUE, IF(MONTH_COST=[Mês do calendário - Revenue, Date#((YEAR_COST & '/' & MONTH_COST),'yyyy/mmm' )))
Expression:
Revenue: Sum(revenue)
Cost: Sum(Cost)
In this case, 2012/APR has not been shown, because the value for the cost do not exist.
How do I unlink the expressions?
193 Views
0 Replies