Unlock a world of possibilities! Login now and discover the exclusive benefits awaiting you.
- Qlik Community
- :
- All Forums
- :
- QlikView App Dev
- :
- Re: Animated dimension & set analysis
- Subscribe to RSS Feed
- Mark Topic as New
- Mark Topic as Read
- Float this Topic for Current User
- Bookmark
- Subscribe
- Mute
- Printer Friendly Page
- Mark as New
- Bookmark
- Subscribe
- Mute
- Subscribe to RSS Feed
- Permalink
- Report Inappropriate Content
Animated dimension & set analysis
Ciao.
I have a problem with animated dimension and set analysis.
The chart that you see in the document has 'Anno' (year) as animated dimension.
In the same chart, ther are 3 expression:
1. 'Femmine' (woman) = sum({$<Sesso={F}>} Data).
2. 'Maschi' (man) = sum({$<Sesso={M}>} Data).
3. 'Femmine al 2013' (woman in year 2013) =sum({$<Sesso={F},Anno={'2013'}>} Data).
The data structure is:
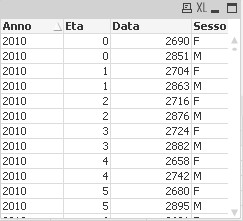
I expect that the expression 'Femmine al 2013' is always visible, but I see the values on the graph only when 'year' = 2013.
Can someone help me please?
Thanks.
Ciao. Michele.
- Mark as New
- Bookmark
- Subscribe
- Mute
- Subscribe to RSS Feed
- Permalink
- Report Inappropriate Content
Hi Michele,
I didn't get much time to look at this, but you probably should use AGGR function for the line.
Below expression works for Femmine al 2013, but only when you select a particular year (or not select any year at all)!
aggr(sum({$<Sesso={F},Anno={2013}>} Data),Eta)
May be also look at using the Reference Line function in the Presentation tab...
Hope this helps!
Manas
- Mark as New
- Bookmark
- Subscribe
- Mute
- Subscribe to RSS Feed
- Permalink
- Report Inappropriate Content
I think you can't use the same field as an animated dimension and the 3d expression because when you use that in the expression you are filtering the field by that value, but try this just in case:
=sum({1<Sesso={F},Anno={'2013'}>} Data)
- Mark as New
- Bookmark
- Subscribe
- Mute
- Subscribe to RSS Feed
- Permalink
- Report Inappropriate Content
I tried your suggestion, but unfortunately does not solve the problem.
Even the reference line does not work.
Thank you  .
.
- Mark as New
- Bookmark
- Subscribe
- Mute
- Subscribe to RSS Feed
- Permalink
- Report Inappropriate Content
It seems that animated dimensions are stronger than Set Analysis.
Thank you. .