Unlock a world of possibilities! Login now and discover the exclusive benefits awaiting you.
- Qlik Community
- :
- All Forums
- :
- QlikView App Dev
- :
- Multiple values on one day (visualized in chart)
- Subscribe to RSS Feed
- Mark Topic as New
- Mark Topic as Read
- Float this Topic for Current User
- Bookmark
- Subscribe
- Mute
- Printer Friendly Page
- Mark as New
- Bookmark
- Subscribe
- Mute
- Subscribe to RSS Feed
- Permalink
- Report Inappropriate Content
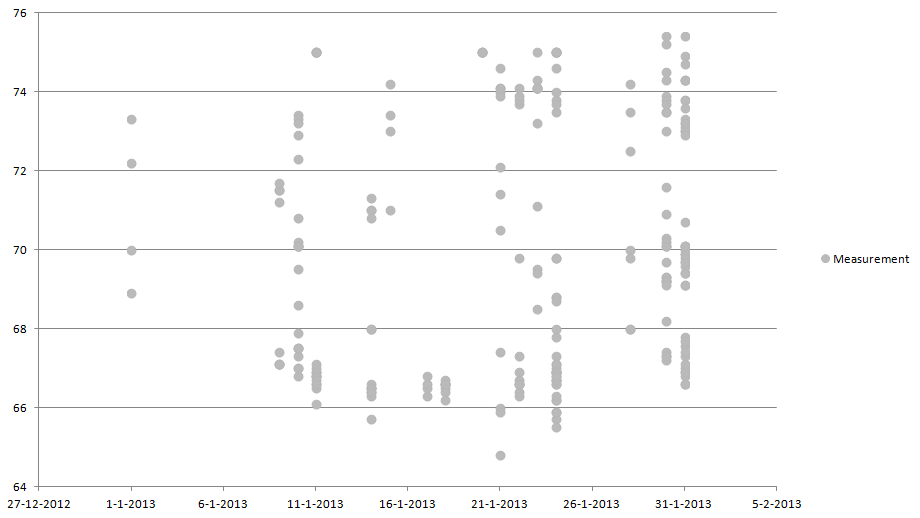
Multiple values on one day (visualized in chart)
I hope someone can help.
I'm trying to visualize a set of measurements into a graph, so it shows me all values on one day without having to Sum( or Avg( them. So a point for every measurement on that day. At the moment I can't seem to get it to work.
In Excel however it's very easy, so I would think QV could handle it as well.
I used the date as Dimension
The measurement value as Expression (so: =Measurement)
Accepted Solutions
- Mark as New
- Bookmark
- Subscribe
- Mute
- Subscribe to RSS Feed
- Permalink
- Report Inappropriate Content
You have a choice of 2 or even 3 charts, and your choice of Dimensions and Expressions will depend on the object:
1. Grid chart - 2 dimensions, 1 expression:
Dim1 = Date
Dim2 = Measurement
Expression = ? Maybe a simple 1 ?
2. Scatter chart - 1 Dimension, 2 Expressions
Dimension - any kind of a unique ID identifying every detailed row of the data.
Expr1 (X) - only(Date)
Expr2 (Y) - only(Measurement)
3. Line (symbol) Chart - 2 Dimensions, 1 expression (I'm not totally sure about it):
Dim1 = Date
Dim2 = Unique ID
Expr. = only(Measurement)
Uncheck "Line" and only use "Symbol" for the expression.
one of those 3 options should give you the desired result.
cheers,
Oleg Troyansky
- Mark as New
- Bookmark
- Subscribe
- Mute
- Subscribe to RSS Feed
- Permalink
- Report Inappropriate Content
Hi Oleg,
Thank you very much!!
The first option worked best for me.