Unlock a world of possibilities! Login now and discover the exclusive benefits awaiting you.
- Qlik Community
- :
- All Forums
- :
- QlikView App Dev
- :
- Re: Assistance with Created vs Closed or OPened vs...
- Subscribe to RSS Feed
- Mark Topic as New
- Mark Topic as Read
- Float this Topic for Current User
- Bookmark
- Subscribe
- Mute
- Printer Friendly Page
- Mark as New
- Bookmark
- Subscribe
- Mute
- Subscribe to RSS Feed
- Permalink
- Report Inappropriate Content
Assistance with Created vs Closed or OPened vs Resolved line chart
Greetings,
My users want me to create this chart in QlikView. Sample of the chart from the Atlassian website
Each record in my DB has a create date field and resolve date field, and the chart has a line for each count. So the red line is count of records opened on [date] and the green line is count of records resolved on that same date.
The problem I'm having is getting the x-axis dates to match up with both fields.
In the charts I'm creating I've been getting the X-axis date from the create date field, so the create count is ok, but I can't get the resolve count to work for that date. I
I can explain further or create some mock up data - unless does anyone know whether this been done before (just based on the chart example at the link)?
Thanks very much,
- Mark as New
- Bookmark
- Subscribe
- Mute
- Subscribe to RSS Feed
- Permalink
- Report Inappropriate Content
Hello,
You need to create a table with both create date and closed date as a single date. You can have an Event field which will tell you if it's closed or open.
Below is an example:
// Raw table
Temp:
Load * inline [
ID,StartDate,EndDate
1,1/1/2013,1/1/2013
2,1/1/2013,1/2/2013
3, 3/1/2013,3/2/2013
4,4/1/2013,5/2/2013
5, 4/1/2013,
];
// Create a new table for Open dates
TicketInfo:
Load ID,
// Start Date and End Date both correspond to single column (Date)
StartDate as Date, 'Open' as Event, 1 as Open_Flag
Resident Temp;
// Concatenate Closed Date info
Concatenate(TicketInfo)
Load ID, EndDate as Date, 'Closed' as Event,
// If EndDate is blank, Closed Flag = 0
if(trim(EndDate)='',0,1) as Closed_Flag
Resident Temp;
// Clean up
drop table Temp;
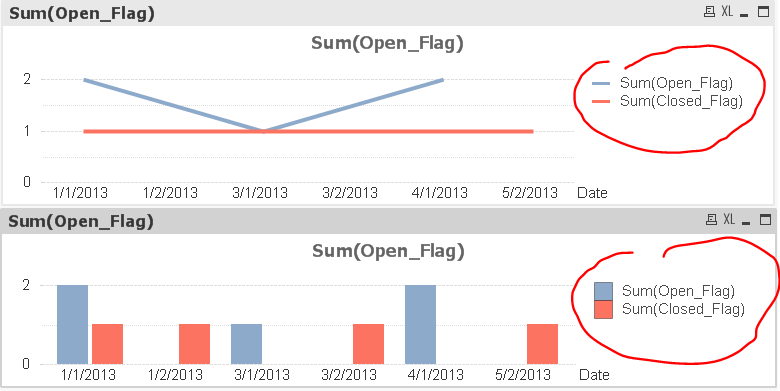
Result:
- Mark as New
- Bookmark
- Subscribe
- Mute
- Subscribe to RSS Feed
- Permalink
- Report Inappropriate Content
When loading data from DB, create a fact table in the format as below. Load the records with create date first. Then concatenate records with resolved date into the same FACT table. Now Date column in FACT table will have both Create Date and Resolved Date
FACT:
Date Status
29/03/13 Create
30/03/13 Resolved
In your chart, use the Date Field for x-Axis and count of Status for y Axis. Create separate expressions for different status that you need
- Mark as New
- Bookmark
- Subscribe
- Mute
- Subscribe to RSS Feed
- Permalink
- Report Inappropriate Content
Thanks all - this worked to get the basic info down, which the user approved.
Two things are still short, though.
1. Is there any way to color the space between the lines as red or green, based on which value is higher? this would go back and forth as more issues are created than closed and vice versa. (I can't create this in excel either.)
2. The sample chart has a value point for every date. so there could be a long string of dates where the data does not change (for example, a week of not creating any new issues), and the line is flat. the QV line has only a sloping line even though I have the continuous x-axis selected. I imagine I need to have a date record with zero issues. I've attached a spreadsheet with that example.
The current chart is good and thanks for everyone's help. I was just wondering if I can get these last two things.
- Mark as New
- Bookmark
- Subscribe
- Mute
- Subscribe to RSS Feed
- Permalink
- Report Inappropriate Content
Hi,
Check attached QVW if it is what you need. I have created a line chart for Created and Resolved and color coded each line.
Regards,
Rakesh
- Mark as New
- Bookmark
- Subscribe
- Mute
- Subscribe to RSS Feed
- Permalink
- Report Inappropriate Content
I got the color coding OK. The thing is that to do color coding between the lines -- ie. below the lines -- the chart automatically adds the two values together. I think it's not possible in QV to color the area below the lines without adding them together.