Unlock a world of possibilities! Login now and discover the exclusive benefits awaiting you.
- Qlik Community
- :
- All Forums
- :
- QlikView App Dev
- :
- Radar Chart - how to get it right?
- Subscribe to RSS Feed
- Mark Topic as New
- Mark Topic as Read
- Float this Topic for Current User
- Bookmark
- Subscribe
- Mute
- Printer Friendly Page
- Mark as New
- Bookmark
- Subscribe
- Mute
- Subscribe to RSS Feed
- Permalink
- Report Inappropriate Content
Radar Chart - how to get it right?
Hi Guys.
This is the situation:
I want to create a radar chart that will have as a Dimenstion all numbers from 1 up until =count({1} distinct [Account ID])) (1 to 87 in my example).
I have many Expressions, each corresponds to a different field, and I need to count the [Account ID] that meets the current slection.
For example:
1. I have 30 account that meet condition 1, and I want a dot on a 1..87 Dimension
2. I have 45 account that meet condition 2, and I want a dot on another 1..87 Dimension
3. I have 12 account that meet condition 3, and I want a dot on another 1..87 Dimension
Each of these dots should be on a different 1..87 Bar, hence creating the Radar. The conditions are calculated by using Set Analysis - no problem there.
The problems are:
1. when I use =count({1} distinct [Account ID])) as a Dimension, I get "Error in calculated Dimension". So I thought it might require a range as a Dimension so I tried this: =ValueLoop (1, count({1} distinct [Account ID]))). Same result.
2. All Expressions are calculated on the same Dimension. See attached.
Thanks for your help!
- Mark as New
- Bookmark
- Subscribe
- Mute
- Subscribe to RSS Feed
- Permalink
- Report Inappropriate Content
No one? 
- Mark as New
- Bookmark
- Subscribe
- Mute
- Subscribe to RSS Feed
- Permalink
- Report Inappropriate Content
Hi,
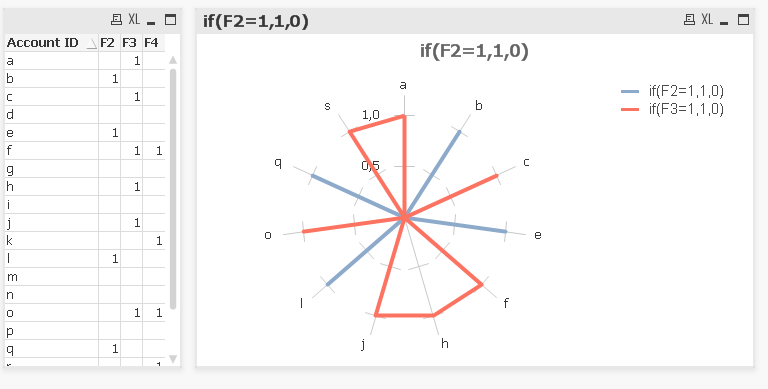
you could look at this example of radar chartRadar Chart
With one dimension you could have (F2, F3, F4 are flags)
- Mark as New
- Bookmark
- Subscribe
- Mute
- Subscribe to RSS Feed
- Permalink
- Report Inappropriate Content
Micherel thanks for your answer.
Unfortunately, that is not what I am looking for.
If I go your way, I have to modify my CSV segnificantly, and I won't have the dynamic data change of Qlik.
This is what I am looking for (there should be only one, Blue or Red Dimension):
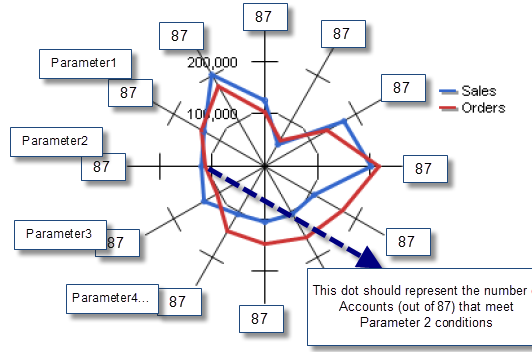
Please note, I have no problem in calculating the dot, I have a problem acheiving this representation.
- Mark as New
- Bookmark
- Subscribe
- Mute
- Subscribe to RSS Feed
- Permalink
- Report Inappropriate Content
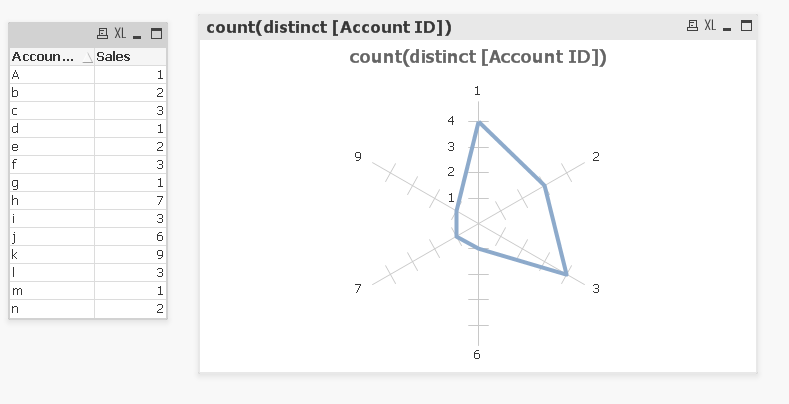
I think you have to set your Parameter1 as dimension and the count as expression.
In this case I have Sales as dimension and the count for the expression, the radar is showing the number of account having 1,2,3 as Sales
- Mark as New
- Bookmark
- Subscribe
- Mute
- Subscribe to RSS Feed
- Permalink
- Report Inappropriate Content
Michele thanks!
I'm almost there, you pointed me in the right direction.
I have created a list in my CSV for the Dimensions.
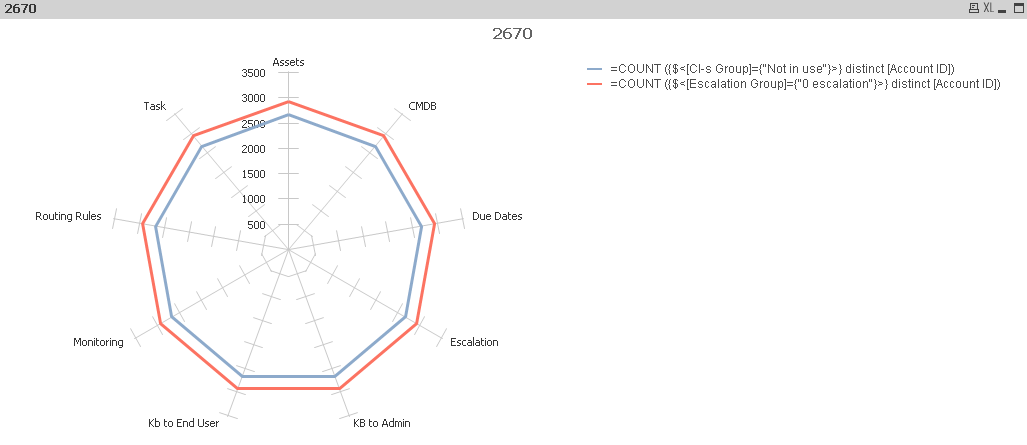
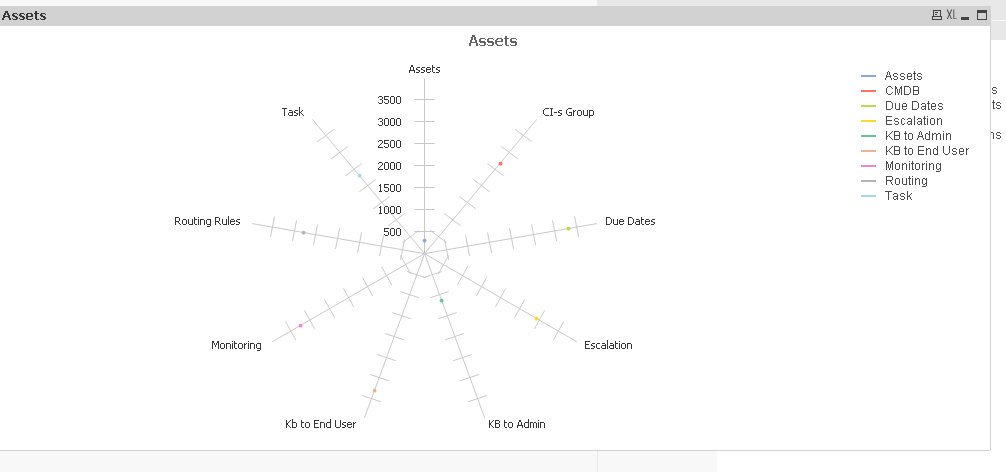
The problem that I have now is that I need to tie each dimension to one and only one expression. As you can see in the attached, I need the blue line to be only a dot on the "CMDB" dimension, and the red line to be a dot on the Escalation dimension. Any idea how it's possible?
- Mark as New
- Bookmark
- Subscribe
- Mute
- Subscribe to RSS Feed
- Permalink
- Report Inappropriate Content
Maybe you could add an if in your expressions
for the blue line if(<Dimension>='CMDB', count(...))
and for the red if(<Dimension>='Escalation', count(...))
- Mark as New
- Bookmark
- Subscribe
- Mute
- Subscribe to RSS Feed
- Permalink
- Report Inappropriate Content
Yes! Michele thank you so much.
I got what I wanted.
I guess there's no way to connect the dots as they represent different expressions...?
- Mark as New
- Bookmark
- Subscribe
- Mute
- Subscribe to RSS Feed
- Permalink
- Report Inappropriate Content
Maybe if you have only one expression with all the nested if...