Unlock a world of possibilities! Login now and discover the exclusive benefits awaiting you.
- Qlik Community
- :
- All Forums
- :
- QlikView App Dev
- :
- Re: Using visual cues in pivot table
- Subscribe to RSS Feed
- Mark Topic as New
- Mark Topic as Read
- Float this Topic for Current User
- Bookmark
- Subscribe
- Mute
- Printer Friendly Page
- Mark as New
- Bookmark
- Subscribe
- Mute
- Subscribe to RSS Feed
- Permalink
- Report Inappropriate Content
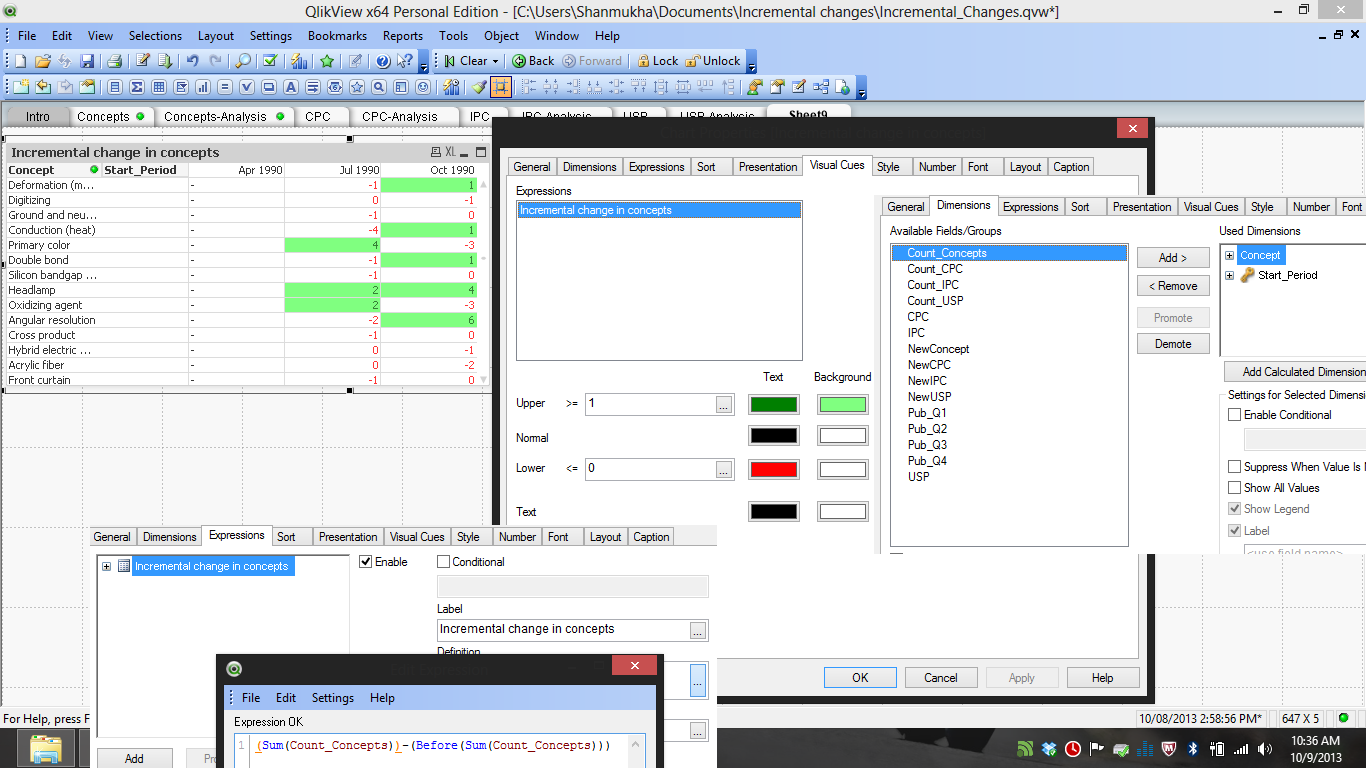
Using visual cues in pivot table
Hi,
I need to color the concepts in green which have green background for two consecutive columns (Ex: Headlamps)
and need to color the concepts in red which have red color font for two consecutive columns. (Ex: shutter speed, disk partitioning)
I have attached the pivot table, the dimensions, the expression used and the visual cues used.
Thanks in advance!
- « Previous Replies
- Next Replies »
- Mark as New
- Bookmark
- Subscribe
- Mute
- Subscribe to RSS Feed
- Permalink
- Report Inappropriate Content
IF(Previous(Concept)=Concept, 'NO', 'YES') as NewConcept
This is how a new concept is defined.
Basically I want to study/identify which concepts have sustained over time/ which concepts have died out based on the difference in the counts of those counts.
- Mark as New
- Bookmark
- Subscribe
- Mute
- Subscribe to RSS Feed
- Permalink
- Report Inappropriate Content
What you can do is
you have +Concept in the dimension
Click on the + sign ,you will get 3-4 option under it,
Click on background and write a expression under it
if([Incremental Change in Concepts]>0,Green(),Red());
- Mark as New
- Bookmark
- Subscribe
- Mute
- Subscribe to RSS Feed
- Permalink
- Report Inappropriate Content
Hi Saumya,
But incremental change in concept for the whole dimension will not make sense right ?
if((Sum(Count_Concepts))-(Before(Sum(Count_Concepts)))>0,Green(),Red())
Because the variable incremental change in concepts has the function BEFORE in it. Which is dependent on the columns of the pivot.
Kindly let know if I need to provide additional data.
- Mark as New
- Bookmark
- Subscribe
- Mute
- Subscribe to RSS Feed
- Permalink
- Report Inappropriate Content
Here is the qvw with restricted data.
Kindly post the answer as a screenshot or in text. As I use a personal edition which cannot open other qvws.
- Mark as New
- Bookmark
- Subscribe
- Mute
- Subscribe to RSS Feed
- Permalink
- Report Inappropriate Content
See i can see you have different months column.
for each you have different values
1)So either you can take the latest month and show that background in concept
or
2)Take the average of all and den show it,you need to think over it.
- Mark as New
- Bookmark
- Subscribe
- Mute
- Subscribe to RSS Feed
- Permalink
- Report Inappropriate Content
and about the dimension thing,Yes you need to take it as a dimension if you are using it
- Mark as New
- Bookmark
- Subscribe
- Mute
- Subscribe to RSS Feed
- Permalink
- Report Inappropriate Content
Hi Saumya,
I understand that part but my requirement is not just the last month and also taking the average wont suffice.
I need to figure out those concepts which have incrementally grown over time. Which means identifying those concepts that have green fields across consecutive months.
And the converse is required to identify the concepts which have declined over time.
- Mark as New
- Bookmark
- Subscribe
- Mute
- Subscribe to RSS Feed
- Permalink
- Report Inappropriate Content
Putting the same question in general QV users sense.
Identifying customers who've bought stuff in an increasing rate throughout the time frame considered.
and identifying the customers who've reduced purchase consistently over the time frame considered.
- Mark as New
- Bookmark
- Subscribe
- Mute
- Subscribe to RSS Feed
- Permalink
- Report Inappropriate Content
Okay there is one more question for this then,
What if it is 1in Oct,-4 in Nov,2 in Dec and -3 in Jan
So how you want to show background of the concept.
GoodOption would be.
You can check previous month and latest month ( If it has grown show green or else red)
- « Previous Replies
- Next Replies »