Unlock a world of possibilities! Login now and discover the exclusive benefits awaiting you.
- Qlik Community
- :
- All Forums
- :
- QlikView App Dev
- :
- Re: Using visual cues in pivot table
- Subscribe to RSS Feed
- Mark Topic as New
- Mark Topic as Read
- Float this Topic for Current User
- Bookmark
- Subscribe
- Mute
- Printer Friendly Page
- Mark as New
- Bookmark
- Subscribe
- Mute
- Subscribe to RSS Feed
- Permalink
- Report Inappropriate Content
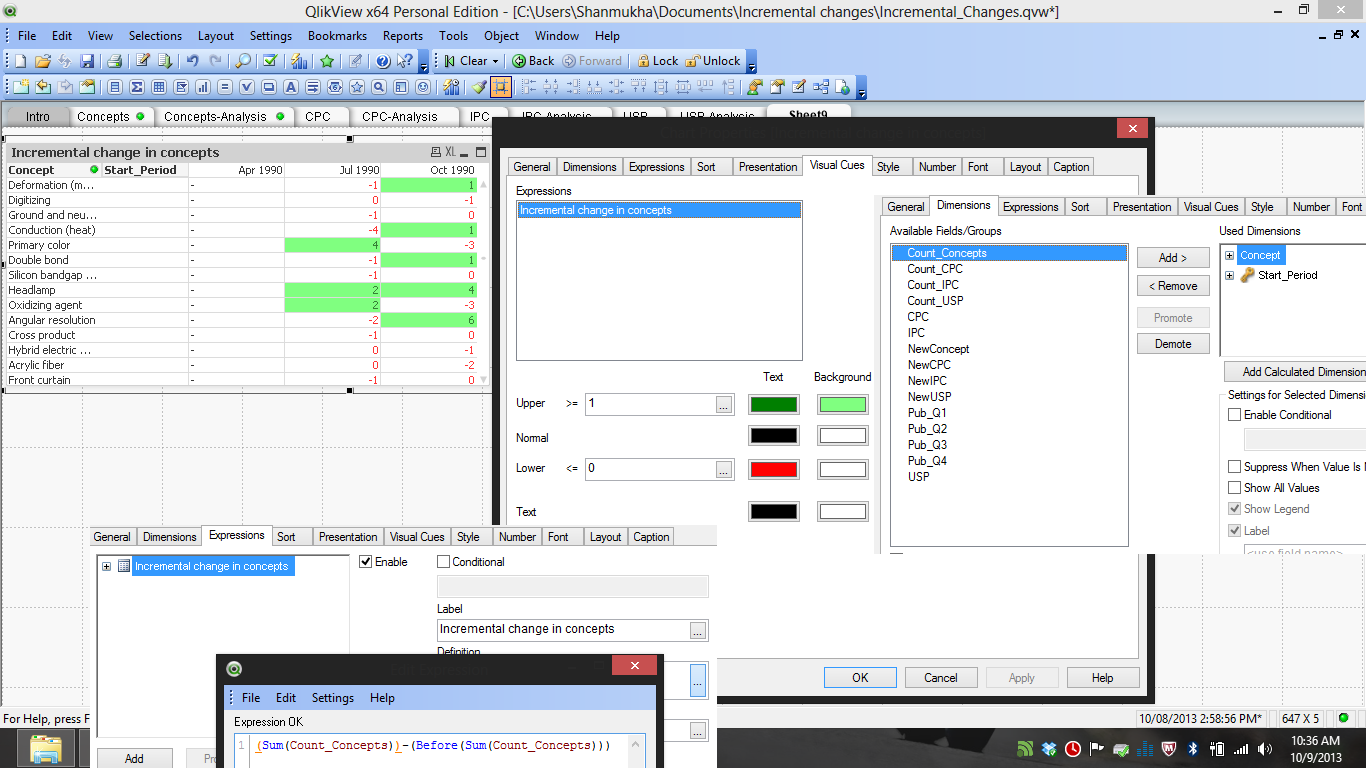
Using visual cues in pivot table
Hi,
I need to color the concepts in green which have green background for two consecutive columns (Ex: Headlamps)
and need to color the concepts in red which have red color font for two consecutive columns. (Ex: shutter speed, disk partitioning)
I have attached the pivot table, the dimensions, the expression used and the visual cues used.
Thanks in advance!
- « Previous Replies
- Next Replies »
- Mark as New
- Bookmark
- Subscribe
- Mute
- Subscribe to RSS Feed
- Permalink
- Report Inappropriate Content
(Sum(Count_Concepts))-(Before(Sum(Count_Concepts)))
This is the expression for those values. (operation based on pivot table columns)
For more clarity u can have a look at the screenshot that I posted in the beginning. It has the dimensions, expression used.
- Mark as New
- Bookmark
- Subscribe
- Mute
- Subscribe to RSS Feed
- Permalink
- Report Inappropriate Content
make two variables
vCurMonth= Date(Today(),'MMM-YYYY')
vPrevMonth=Month(Addmonths(Today(),-1))&'-'&Date(Today(),'YYYY')
- Mark as New
- Bookmark
- Subscribe
- Mute
- Subscribe to RSS Feed
- Permalink
- Report Inappropriate Content
Dosth,
All this is historical data. Curmonth , previous month ka kuch upyog nahi.
How to get the last month of the data and the last previous month of the data ??
- Mark as New
- Bookmark
- Subscribe
- Mute
- Subscribe to RSS Feed
- Permalink
- Report Inappropriate Content
FYI
And also it is not monthly data.
It is quarterly data
- « Previous Replies
- Next Replies »