Unlock a world of possibilities! Login now and discover the exclusive benefits awaiting you.
- Qlik Community
- :
- All Forums
- :
- QlikView App Dev
- :
- Re: bar chart sum last year total
- Subscribe to RSS Feed
- Mark Topic as New
- Mark Topic as Read
- Float this Topic for Current User
- Bookmark
- Subscribe
- Mute
- Printer Friendly Page
- Mark as New
- Bookmark
- Subscribe
- Mute
- Subscribe to RSS Feed
- Permalink
- Report Inappropriate Content
bar chart sum last year total
hi all,
bar chart sum last year total
sum( {$<Year={"<=$(Year)-1"}>} value)
Dimensions : if(MonthYear >= '012013',MonthYear)
bar chart value :
012013 > 60
022013 > 60
032013 > 60
042013 > 60
052013 > 60
062013 > 60
072013 > 60
082013 > 60
092013 > 60
102013 > 60
112013 > 60
122013 > 60
- Tags:
- qlikview_scripting
- « Previous Replies
-
- 1
- 2
- Next Replies »
- Mark as New
- Bookmark
- Subscribe
- Mute
- Subscribe to RSS Feed
- Permalink
- Report Inappropriate Content
do you want to show values greater than 60 only ? I couldn't understand your question !!
- Mark as New
- Bookmark
- Subscribe
- Mute
- Subscribe to RSS Feed
- Permalink
- Report Inappropriate Content
hi Yousef,
Dimensions >> montyear (YTD) total. I want to do.
Year to day total
how can ?
example : bar chart Dimensions >> montyear 08-2013
< 08-2013 + > 01-2013
value YTD total > 130+140+150+160+170+180+190+200 = 1320
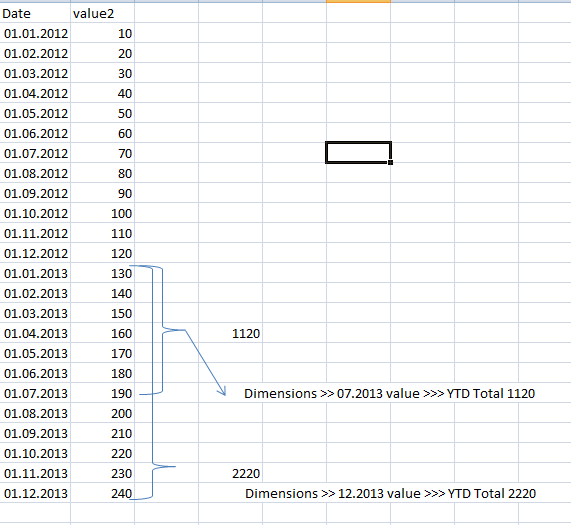
example : bar chart Dimensions >> montyear 07-2013
value YTD total > 130+140+150+160+170+180+190 = 1120
- Mark as New
- Bookmark
- Subscribe
- Mute
- Subscribe to RSS Feed
- Permalink
- Report Inappropriate Content
see the attached file, I think it's working
- « Previous Replies
-
- 1
- 2
- Next Replies »