Unlock a world of possibilities! Login now and discover the exclusive benefits awaiting you.
- Qlik Community
- :
- All Forums
- :
- QlikView App Dev
- :
- Re: Removing extraneous/empty dimensions
- Subscribe to RSS Feed
- Mark Topic as New
- Mark Topic as Read
- Float this Topic for Current User
- Bookmark
- Subscribe
- Mute
- Printer Friendly Page
- Mark as New
- Bookmark
- Subscribe
- Mute
- Subscribe to RSS Feed
- Permalink
- Report Inappropriate Content
Removing extraneous/empty dimensions
Hi everyone--
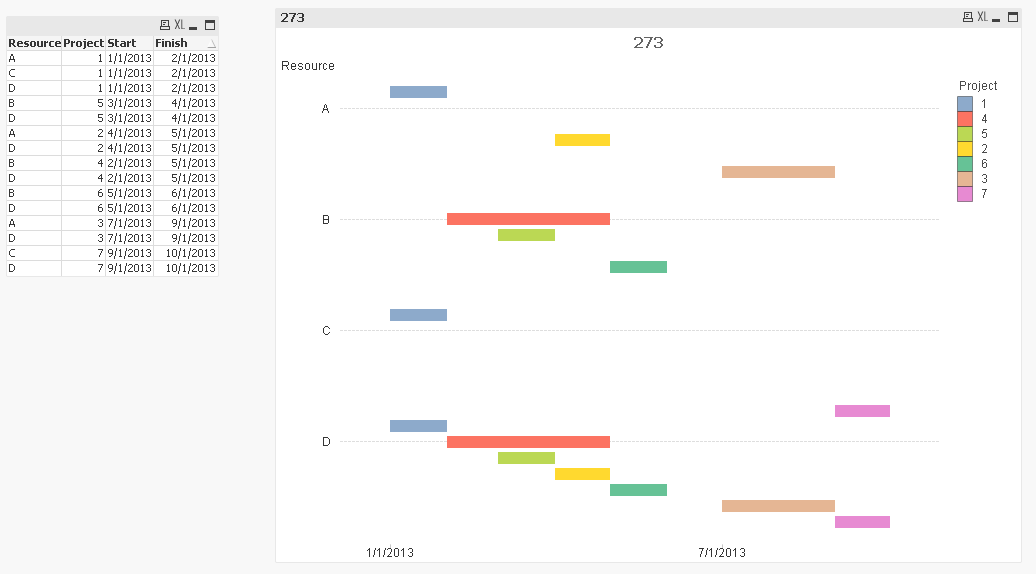
I am working on a gantt chart that uses 2 dimensions to group date data together. To illustrate the issue, I have created the sample file attached to this post.
In the screenshot below, Resource D's data shows up as intended--the data are in order and no lines are wasted because D is assigned to projects 1-7. However, for the other resources (A-C), dimension lanes still exist for the other projects even though they don't exist in my data model. For example, A is not assigned to projects 4 or 5, but the gap for the dimension still exists anyway.
-Before you ask, I already tried Suppress Missing, Suppress Null
-I also tried using AGGR() to try and roll up only the projects that exist to the resources that have them. No luck with that, unless somebody has another way of using AGGR().
-I further tried to sort them under the Sort tab (even with AGGR again!) but no dice either.
-Stacking vs grouping bar charts is not an acceptable solution because there are instances where projects overlap
Thanks in advance!
- Mark as New
- Bookmark
- Subscribe
- Mute
- Subscribe to RSS Feed
- Permalink
- Report Inappropriate Content
I belive there is ever place for the same number of values. You can only sort them if you use a dynamic dimension and shows the top 5 or something and use the color expression to paint it ever in the same color.