Unlock a world of possibilities! Login now and discover the exclusive benefits awaiting you.
- Qlik Community
- :
- All Forums
- :
- QlikView App Dev
- :
- Re: Linear Gauge -ve
- Subscribe to RSS Feed
- Mark Topic as New
- Mark Topic as Read
- Float this Topic for Current User
- Bookmark
- Subscribe
- Mute
- Printer Friendly Page
- Mark as New
- Bookmark
- Subscribe
- Mute
- Subscribe to RSS Feed
- Permalink
- Report Inappropriate Content
Linear Gauge -ve
Hello all,
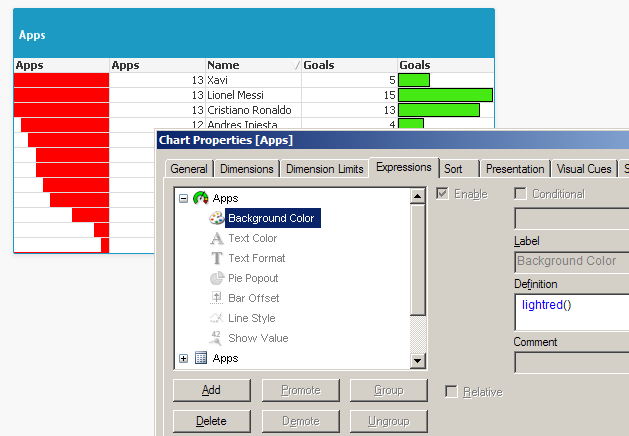
Im trying to make a table with two linear gauges on the sides, one going right to left, one going left to right.
I have attached an example of what I am trying to do - The green bar is good, but the red bar is bad
Basically, the space that the red bar doesn't fill is what I want to show, so ii am hoping there is a way I can fill the rest of the cell a colour and the just change the red to white.
Is this possible?
Thanks
Accepted Solutions
- Mark as New
- Bookmark
- Subscribe
- Mute
- Subscribe to RSS Feed
- Permalink
- Report Inappropriate Content
Click on the + in front of the gauge expression, select Background color and enter lightred() in the Definition box.
talk is cheap, supply exceeds demand
- Mark as New
- Bookmark
- Subscribe
- Mute
- Subscribe to RSS Feed
- Permalink
- Report Inappropriate Content
Click on the + in front of the gauge expression, select Background color and enter lightred() in the Definition box.
talk is cheap, supply exceeds demand
- Mark as New
- Bookmark
- Subscribe
- Mute
- Subscribe to RSS Feed
- Permalink
- Report Inappropriate Content
Thank you!
- Mark as New
- Bookmark
- Subscribe
- Mute
- Subscribe to RSS Feed
- Permalink
- Report Inappropriate Content
Thank you for this post. It helped me a lot.
I have an additional question. If you open this qv-file in the WebView (AJAX) the graph looks like this:
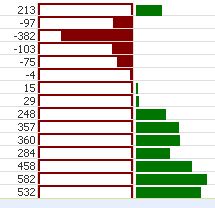
I tried to hide the red borders with the window "Custom Format Cell" within the "Design Grid". There I tried to colour the Borders white and made bigger but that diden't really help. Do you have any solutions?
Thanks for any answer
- Mark as New
- Bookmark
- Subscribe
- Mute
- Subscribe to RSS Feed
- Permalink
- Report Inappropriate Content
Hi,
I also have this problem, did you solve this?
Thanks,
Fredrik
- Mark as New
- Bookmark
- Subscribe
- Mute
- Subscribe to RSS Feed
- Permalink
- Report Inappropriate Content
Any updates on this issue?