Unlock a world of possibilities! Login now and discover the exclusive benefits awaiting you.
- Qlik Community
- :
- All Forums
- :
- QlikView App Dev
- :
- Re: Re: FirstSortedValue in Line Chart
- Subscribe to RSS Feed
- Mark Topic as New
- Mark Topic as Read
- Float this Topic for Current User
- Bookmark
- Subscribe
- Mute
- Printer Friendly Page
- Mark as New
- Bookmark
- Subscribe
- Mute
- Subscribe to RSS Feed
- Permalink
- Report Inappropriate Content
FirstSortedValue in Line Chart
HI.
I'm trying to use this function to retrieve the firstsortedvalue of revenue expression, in a line chart, with Date and Customer dimensions.
Basically, I want the value to be the first one shown in the chart with respect to the other parameters chosen.
The overall idea here is to divide each month's revenue by the first sorted value's revenue, to achieve % change.
But I can't get the firstsortedvalue to work properly.
Here is my syntax, which clearly has problems because it does not retrieve any data.
=$(vPremiumRevenue) / FirstSortedValue($(vPremiumRevenue), [MonthYear], [Customer Name])
Any idea what I'm doing wrong here?
Thanks!
- « Previous Replies
-
- 1
- 2
- Next Replies »
- Mark as New
- Bookmark
- Subscribe
- Mute
- Subscribe to RSS Feed
- Permalink
- Report Inappropriate Content
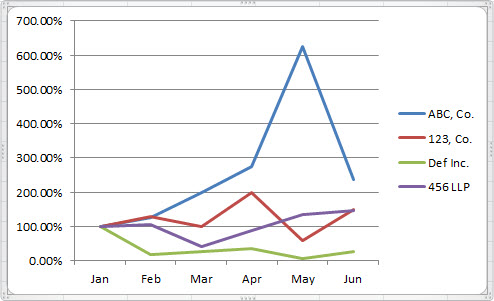
Here's an Excel example of what I'm trying to achieve.
Imagine here that the user had selected Months of Jan-Jun. This would be the output.
Jan is always 100% (1), while the next months are the % up or down the revenue amount is compared to Jan.
- Mark as New
- Bookmark
- Subscribe
- Mute
- Subscribe to RSS Feed
- Permalink
- Report Inappropriate Content
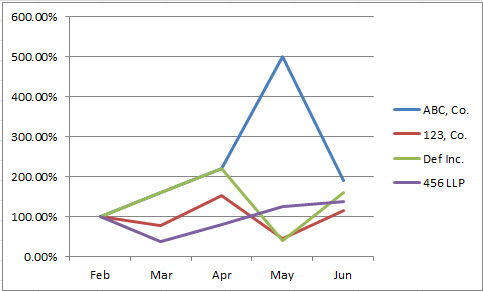
And this would be the output if you selected Feb-Jun.
- Mark as New
- Bookmark
- Subscribe
- Mute
- Subscribe to RSS Feed
- Permalink
- Report Inappropriate Content
It´s not elegant, but seems to work,
Check if fits your needs
- Mark as New
- Bookmark
- Subscribe
- Mute
- Subscribe to RSS Feed
- Permalink
- Report Inappropriate Content
Firstly, I want to say thanks for the sample. Yours works perfectly.
I haven't been able to replicate it in my environment though.
Not sure why. Below is my script.
My line graph expression:
=Sum(if(Month=MonthYear,$(=vPremiumRevenue)))/sum({<Month={"$(=(min(date(MonthYear)),'MMM-
YYYY'))"}>}$=(vPremiumRevenue))
vPremiumRevenue is a set analysis variable defined as:
=Sum({$<TAMSFeeType = {'TAMSRF'}, CustomerSource={'TAMS'}>}[GP Credit Amount]-[GP Debit Amount]) +
Sum({$<TAMSFeeType = {'TAMSAF'}, CustomerSource={'TAMS'}>}[GP Credit Amount]-[GP Debit Amount])
MonthYear is formatted as follows: Jan-2012
Again, I'm a beginner here, and haven't quite grasped some of the syntax or when to use $ and =.
Hopefully this makes sense and you could guide me in the right direction.
Thanks again.
- Mark as New
- Bookmark
- Subscribe
- Mute
- Subscribe to RSS Feed
- Permalink
- Report Inappropriate Content
Try this
=Sum(if(Month=MonthYear,$(vPremiumRevenue)))/sum({<Month={"$(=(min(date(MonthYear)),'MMM-
YYYY'))"}>}$(vPremiumRevenue))
- Mark as New
- Bookmark
- Subscribe
- Mute
- Subscribe to RSS Feed
- Permalink
- Report Inappropriate Content
That didn't work either. The problem seems to be partially in the first statement, where it says if(Month=MonthYear).
Those two fields are formatted differently. If I change it to MonthYear=MonthYear, I get data.
However, i am still unable to obtain the revenue for the first selected MonthYear.
This expression always returns the sum of all of the selected months' revenue, instead of just the first selected month's revenue.
=sum({<MonthYear={"$(=(min(MonthYear),'MMM-
YYYY'))"}>}$(vPremiumRevenue))
It does the same thing if I change the variable at the end to just vPremiumRevenue w/o the $...
Any idea what I'm doing wrong?
- Mark as New
- Bookmark
- Subscribe
- Mute
- Subscribe to RSS Feed
- Permalink
- Report Inappropriate Content
What is the value of Month and MonthYear
Is it 'Jan', 'Feb',
'Jan 2013', 'Feb 2013' ???
then you need to convert MonthYear every time by
=Date(MonthYear, 'MMM')
- Mark as New
- Bookmark
- Subscribe
- Mute
- Subscribe to RSS Feed
- Permalink
- Report Inappropriate Content
Michael in Qlikview: TOTAL and AGGR in chart expression
Just wanted to say thanks to everyone who helped me out with this. I finally got a working version for my data model.
I managed to find a thorough explanation and example at the above link, in case anyone else is looking to do this sort of thing.
Thanks again to all.
- « Previous Replies
-
- 1
- 2
- Next Replies »