Unlock a world of possibilities! Login now and discover the exclusive benefits awaiting you.
- Qlik Community
- :
- All Forums
- :
- QlikView App Dev
- :
- Re: Show last / most recent plotted expression val...
- Subscribe to RSS Feed
- Mark Topic as New
- Mark Topic as Read
- Float this Topic for Current User
- Bookmark
- Subscribe
- Mute
- Printer Friendly Page
- Mark as New
- Bookmark
- Subscribe
- Mute
- Subscribe to RSS Feed
- Permalink
- Report Inappropriate Content
Show last / most recent plotted expression value on chart?
For some reason my post on the same topic yesterday appears to not have made it through moderation so am trying again.
Given a typical chart, below I wish to show the data value on the chart but only for the most recent / right-hand-most record displayed - e.g. I want to see something like the yellow highlighted areas below, either approach will do for me.
![2QlikView x64 - [X__40 MODELS_WIP-MarkerEfficiency-test.qvw_]_2013-11-21_12-50-13.png](/legacyfs/online/49357_2QlikView x64 - [X__40 MODELS_WIP-MarkerEfficiency-test.qvw_]_2013-11-21_12-50-13.png)
I know Expressions -> Values on data points exists but as you know this shows all values and on narrow bars is effectively illegible for my purposes.
I tried adaptations of Qlik Tips: Lose the Legend in Line Charts
where use of the Values on data points feature is used with a formula along these lines:
Dual( If(MonthYear=Max(total MonthYear), CategoryType, ''), Sum(Sales) )
I've tried various approaches using my fields and tables but am not getting the expression field value to display. I'm just getting either Null or the dimension value to plot.
Using a date axis on the above I couldnt get it to work, so I tried another way using firstsortedvalue in a text box but using data as the x-axis it only shows me Null. I then tried with a product/itemreference and it showed me the correct itemreference but not the value of [Marker Efficiency] at that point. I also noticed that this method worked fine in a text box but not when doing something like putting
='Latest Efficiency = ' & firstsortedvalue( itemReference1,-Aggr( Avg( Distinct [Marker Efficiency]),itemReference1 )) in the window or chart title, there it shows the expression text but not its evalued form.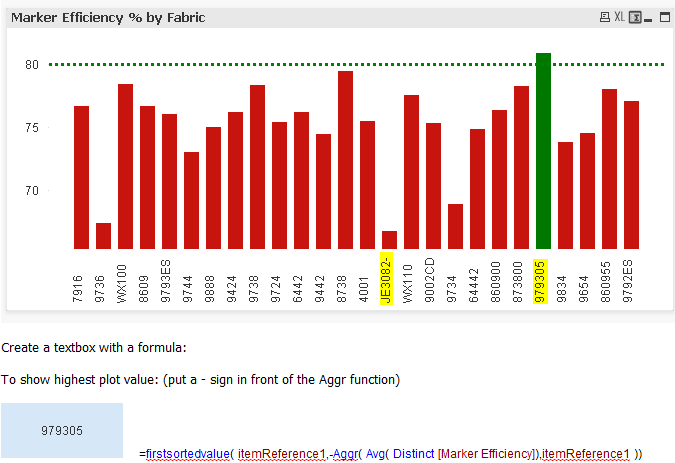
Can I get firstsortedvalue to work with a date dimension on the x-axis and then display the expression (bar plot) value of the last plotted expression?
I also tried using the Peek function but only get Nulls that way too.
How can I achive what I'm trying to do. First graph - the yellow highlights above. Thanks
- Mark as New
- Bookmark
- Subscribe
- Mute
- Subscribe to RSS Feed
- Permalink
- Report Inappropriate Content
Please do not post the same thing multiple times. The reply to this is on: Display / determine value of most recent datapoint in chart?
- Mark as New
- Bookmark
- Subscribe
- Mute
- Subscribe to RSS Feed
- Permalink
- Report Inappropriate Content
Thanks, I usually would not do multiple posts but in this case moderation was taking > 24 hrs and with the great contributors in the forums In the past often one would have a solution posted in a hour or two so I was unsure what the issue was this time and what had happenned to my posting (i.e. whether it had gotten lost or whether there was just a delay in moderation) so I tried again, but after 2 days concluded it wasnt ever going to work so left it.