Unlock a world of possibilities! Login now and discover the exclusive benefits awaiting you.
- Qlik Community
- :
- All Forums
- :
- QlikView App Dev
- :
- Re: Help with a pivot table
- Subscribe to RSS Feed
- Mark Topic as New
- Mark Topic as Read
- Float this Topic for Current User
- Bookmark
- Subscribe
- Mute
- Printer Friendly Page
- Mark as New
- Bookmark
- Subscribe
- Mute
- Subscribe to RSS Feed
- Permalink
- Report Inappropriate Content
Help with a pivot table
Henric Cronström,Rob Wunderlich,Miguel Angel Baeyens,
Hi I have a requirement where I need to create a pivot table with a Product field, which has to be used twice, both pivoted and non pivoted position.
The metric that I need to calculate is a venn diagram which will calculate the number of customers which use the combinations of any two products.
following is a sample of the resulting chart i need to create
| Product | A | B | C | D |
| A | 3 | 4 | 2 | 9 |
| B | 4 | 8 | 6 | 3 |
| C | 2 | 6 | 10 | 7 |
| D | 9 | 3 | 7 | 4 |
The data is available is Year, Quarter, Product, Country, Customer.
I am facing a problem on how to segregate the values for a pair of particular product types. I tried a lot of ways to create a combination of two products, but I am not able to get the correct numbers.
Please help.
Thanks,
Abhinava
Accepted Solutions
- Mark as New
- Bookmark
- Subscribe
- Mute
- Subscribe to RSS Feed
- Permalink
- Report Inappropriate Content
A classical Basket analysis...
First: How do you define a "basket"? Is it if a customer has used the two products within a Quarter and in the same Country, or is it worldwide since the beginning of time?
Once you have defined your "basket", you should define an ID for that in the script. Further, you need to create a side table using
ProductB:
Load BasketID, Product as ProductB, ItemID as ItemB_ID Resident Baskets;
Then you will get a data model like
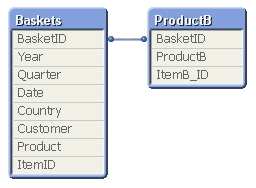
Now you can create your pivot table using Product and ProductB as dimensions, and
Count(distinct If(ItemID<>ItemB_ID,BasketID))
as expression.
It might be possible to do all this in the pivot table using Set Analysis, Aggr and value loops, but it won't be easy...
HIC
- Mark as New
- Bookmark
- Subscribe
- Mute
- Subscribe to RSS Feed
- Permalink
- Report Inappropriate Content
A classical Basket analysis...
First: How do you define a "basket"? Is it if a customer has used the two products within a Quarter and in the same Country, or is it worldwide since the beginning of time?
Once you have defined your "basket", you should define an ID for that in the script. Further, you need to create a side table using
ProductB:
Load BasketID, Product as ProductB, ItemID as ItemB_ID Resident Baskets;
Then you will get a data model like
Now you can create your pivot table using Product and ProductB as dimensions, and
Count(distinct If(ItemID<>ItemB_ID,BasketID))
as expression.
It might be possible to do all this in the pivot table using Set Analysis, Aggr and value loops, but it won't be easy...
HIC
- Mark as New
- Bookmark
- Subscribe
- Mute
- Subscribe to RSS Feed
- Permalink
- Report Inappropriate Content
Have a look at this option

- Mark as New
- Bookmark
- Subscribe
- Mute
- Subscribe to RSS Feed
- Permalink
- Report Inappropriate Content
Hi HIC,
Thanks for the reply.
The "Basket" that I have to create is the count(customers+country) which use any pair of products and it is for every quarter.
So what I am thinking is to create a table which will give me the Country and Customers which use atleast two products and the combination of those every 2 products.
Am I on the right track?
A little help would be highly appreciated!
Thanks,
Abhinava
- Mark as New
- Bookmark
- Subscribe
- Mute
- Subscribe to RSS Feed
- Permalink
- Report Inappropriate Content
It sounds to me as if your BasketID should be Quarter + Customer + Country:
Quarter & '|' & Customer & '|' & Country as BasketID
If you use the solution sketched above, but with this BasketID, I think it will work the way you want it. But you will need to have a selection of a single quarter, otherwise the expression will count the same customer several times - once per quarter.
HIC
- Mark as New
- Bookmark
- Subscribe
- Mute
- Subscribe to RSS Feed
- Permalink
- Report Inappropriate Content
Awesome Henric!!
Thanks for all the help!!
Regards,
Abhinava