Unlock a world of possibilities! Login now and discover the exclusive benefits awaiting you.
- Qlik Community
- :
- All Forums
- :
- QlikView App Dev
- :
- Re: Continous in charts
- Subscribe to RSS Feed
- Mark Topic as New
- Mark Topic as Read
- Float this Topic for Current User
- Bookmark
- Subscribe
- Mute
- Printer Friendly Page
- Mark as New
- Bookmark
- Subscribe
- Mute
- Subscribe to RSS Feed
- Permalink
- Report Inappropriate Content
Continous in charts
Hi all,
I have a strange question which i cant seem to figure out.
Let me post some examples:
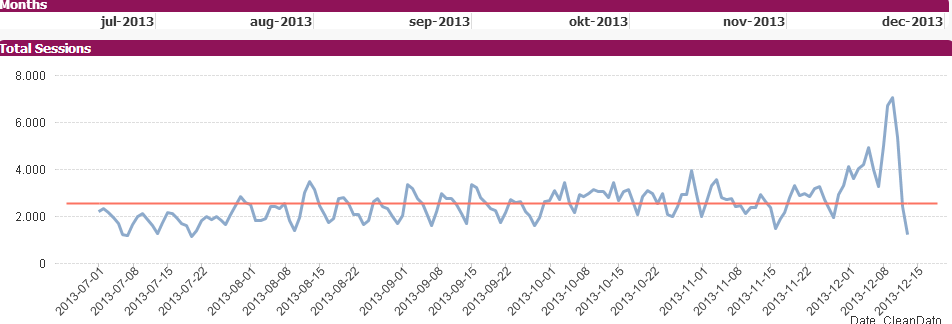
1: Data from all time - Using continous load to see from start to end date - Thats fine
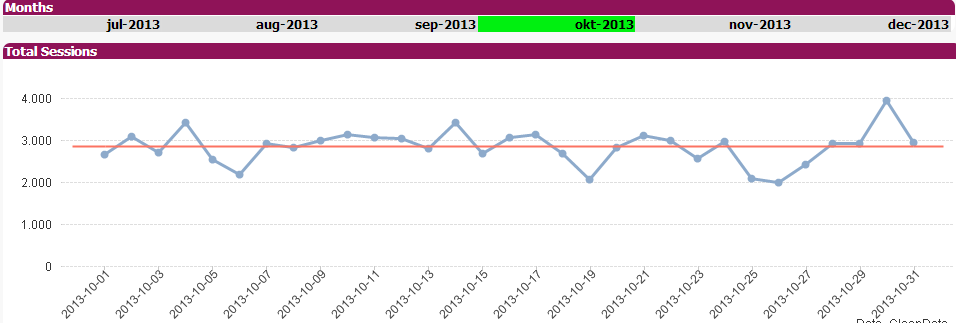
2: Now i select a Month okt - It shows me data from the first to the 31 - This is also fine
3: Now i select two other months - Now it takes on dates from the other month on both pictures (Notice my blue expression is correct with data, but my avg goes all the way
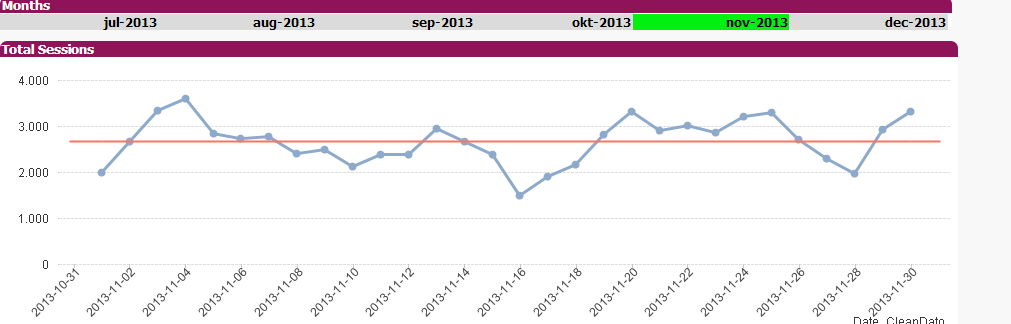
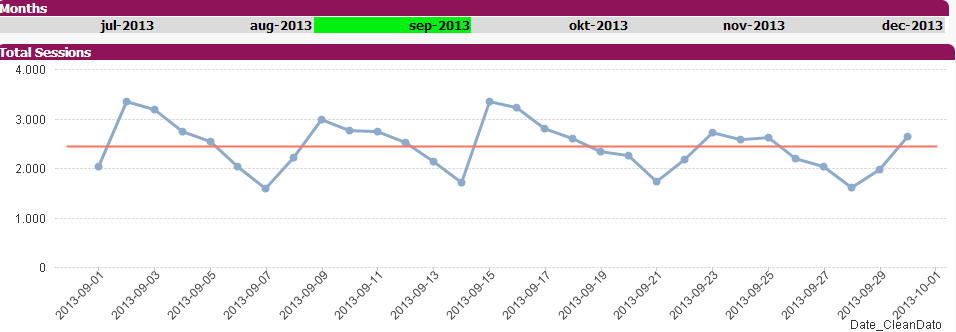
This is my avg expression:
=avg(aggr(sum(TotalSessions),Date_CleanDato)
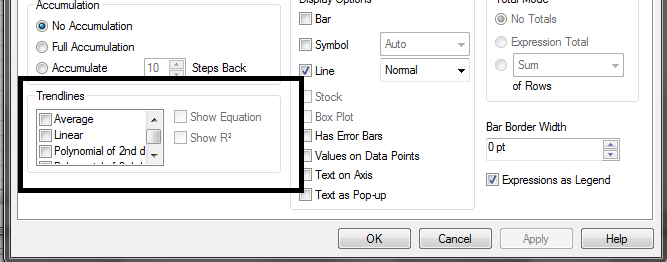
And it does the same if i select AVG under trendlines
But i also happens if i dont have any AVG included at all
Accepted Solutions
- Mark as New
- Bookmark
- Subscribe
- Mute
- Subscribe to RSS Feed
- Permalink
- Report Inappropriate Content
The continous axis is sometimes a bit hard to handle, also when you want to show several defined axis points, like dates for the month start). QV takes quite a lot of control over the visuals here.
For your specific issue, you can try setting defined static min / max values for the continuous axis:
=min(Date_CleanDato)
=max(Date_CleanDato)
This usually works for me.
- Mark as New
- Bookmark
- Subscribe
- Mute
- Subscribe to RSS Feed
- Permalink
- Report Inappropriate Content
Hi Thomas,
Can't you use a Default QV Avg function for your chart??
Under Expression Tab
- Mark as New
- Bookmark
- Subscribe
- Mute
- Subscribe to RSS Feed
- Permalink
- Report Inappropriate Content
As i wrote in the buttom, i also tried with that. But its the same result. And the date problem is also a problem if i dont have any AVG 😕
- Mark as New
- Bookmark
- Subscribe
- Mute
- Subscribe to RSS Feed
- Permalink
- Report Inappropriate Content
The continous axis is sometimes a bit hard to handle, also when you want to show several defined axis points, like dates for the month start). QV takes quite a lot of control over the visuals here.
For your specific issue, you can try setting defined static min / max values for the continuous axis:
=min(Date_CleanDato)
=max(Date_CleanDato)
This usually works for me.
- Mark as New
- Bookmark
- Subscribe
- Mute
- Subscribe to RSS Feed
- Permalink
- Report Inappropriate Content
Okay, yes it is very strange that it is forcing the dates to be visualized even though they are not represented in the selection.
Why didnt i think of that - Thanks a lot 