Unlock a world of possibilities! Login now and discover the exclusive benefits awaiting you.
- Qlik Community
- :
- All Forums
- :
- QlikView Administration
- :
- Re: 11.2 QVS does not flush memory (?)
- Subscribe to RSS Feed
- Mark Topic as New
- Mark Topic as Read
- Float this Topic for Current User
- Bookmark
- Subscribe
- Mute
- Printer Friendly Page
- Mark as New
- Bookmark
- Subscribe
- Mute
- Subscribe to RSS Feed
- Permalink
- Report Inappropriate Content
11.2 QVS does not flush memory (?)
Hi,
Since last week we switched over to a brand new Qlikview environment. Our setup include Qlikview Enterprise Server 11.2 SR4 on top of Windows Server 2012, Intel Xeon with 24 cores 128GB RAM.
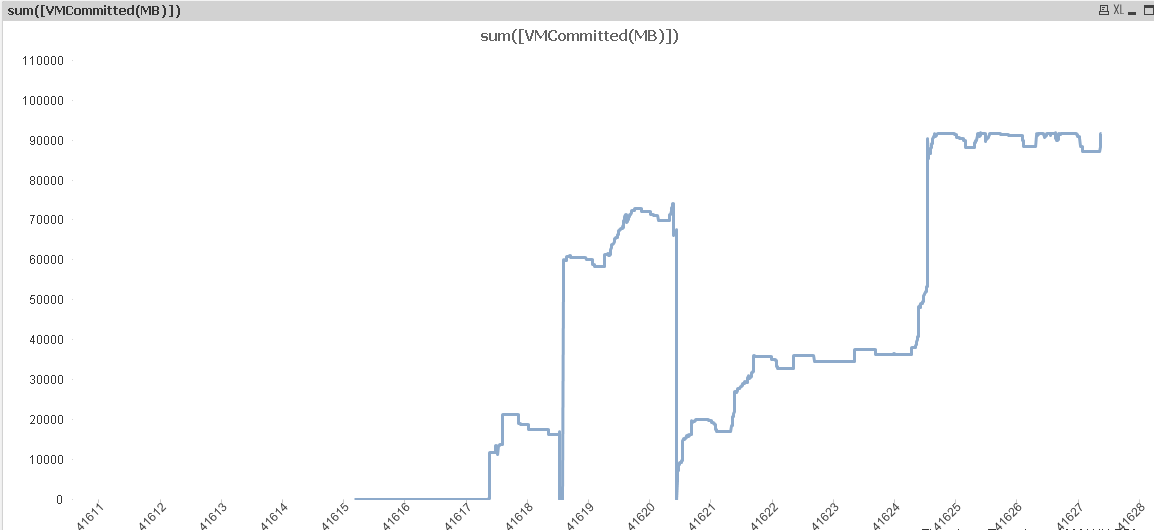
In our old env. we had an average of 16GB RAM commited from the the 24GB. In the new env. it starts with 16GB but climbs steadily to 91GB(!). If you restart the qvs service it does go back to 16 but climbs back again to it's "comfort zone".
I know Qlikview "loves" memory and this behavior is partly by design but it seems to me unacceptable to restart the server every second day.
Any Idea's?
- Tags:
- qlikview_deployment
- Mark as New
- Bookmark
- Subscribe
- Mute
- Subscribe to RSS Feed
- Permalink
- Report Inappropriate Content
Hi Dror,
I have seen this with a customer of ours.
I don't have a solution but what I did is that I created a .bat file with commands to stop en start the services again.
This .bat file I scheduled every night with Windows Scheduler.
This is the script in the bat file
REM SCRIPT STARTS HERE
@echo off
REM ---------------------------
REM This batch will stop the QlikView Services, and restart the services again.
net stop "QlikView Webserver"
net stop "QlikView Directory Service Connector"
net stop "QlikView Distribution Service"
net stop "QlikView Management Service"
net stop "QlikView Server"
timeout /t 20
net start "QlikView Server"
net start "QlikView Directory Service Connector"
net start "QlikView Distribution Service"
net start "QlikView Management Service"
net start "QlikView Webserver"
REM SCRIPT ENDS HERE
I hope it helps
- Mark as New
- Bookmark
- Subscribe
- Mute
- Subscribe to RSS Feed
- Permalink
- Report Inappropriate Content
Dror
The behaviour you describe is QVS working as designed.
It exploits massive caching which is one of the reasons why QV Dashboards normally have very quick response times.
There is no need to restart any Services / Servers regularly as when QVS notices the Server RAM is getting too full it will age things out of cache to allow fresh things to be cached.
Best Regards, Bill
- Mark as New
- Bookmark
- Subscribe
- Mute
- Subscribe to RSS Feed
- Permalink
- Report Inappropriate Content
Jeroen,
This at the moment also our preferred approach but it would , however be nice if Qlikview could do that for you..
It took me a while to convince my boss to switch over to 11 as it (presumably) have a better memory management. Now we have this... 
mooie script trouwens 
- Mark as New
- Bookmark
- Subscribe
- Mute
- Subscribe to RSS Feed
- Permalink
- Report Inappropriate Content
Bill,
What is then the memory threshold for flush?
With our previous machine, (QV10) , the machine crashed every second day due to memory surge...
Dror
- Mark as New
- Bookmark
- Subscribe
- Mute
- Subscribe to RSS Feed
- Permalink
- Report Inappropriate Content
Dror
The memory Working Set is defined in the QMS, found here :
- System
- Setup
- QlikView Servers, select your server name
- Performance tab
- You'll see the Working Set values, default Low 70%, High 90%
- If on this screen you click Help, it is context sensitive and takes you straight to the relevant Help page.
You say the old machine had crashing issue, does the new server ?
Are you running anything else on the new Server ?
Are the old & new servers physical or virtual ?
Best Regards, Bill
- Mark as New
- Bookmark
- Subscribe
- Mute
- Subscribe to RSS Feed
- Permalink
- Report Inappropriate Content
Hi,
I'm sure you are aware this is normal QVS behaviour. QVS will take advantage of caching and it helps the users who login to access the application by positive performance. QVS will do caching until it reaches the Low and the High Set limit. (By default 70% and 90%). The purpose of having hardware resources is to take advantage and QVS does the same. However, it should delete the cache after reaching the threshold which is 90% by default. And generally Server becomes very slow when it reaches the limit and sometimes it will crash and only way to restore the system is by restarting the Server.
If you are having this issue where RAM is not being released then please check the below settings:
1. Allow Only One Copy of Document in Memory (This should be enabled because if you are creating multiple versions of the same document then it will hurt your Ram Usage).
2. Check if there is any Virus scan on the mounted folder and if possible raise an exception for this folder.
3. Use Windows PerfMon and check for the peaks by using Memory, Processor and Cache groups. Add the relevant counters and do some baby sitting with the Server to understand which document/ App is causing the issue.
Also; if the working set limits (70/90) is hit, QVS will only flush parts of the cache to get the memory usage below the limit that triggered the purge, not removing all cache for that document.
I hope this helps!
Cheers,
DV
- Mark as New
- Bookmark
- Subscribe
- Mute
- Subscribe to RSS Feed
- Permalink
- Report Inappropriate Content
Hi,
I think the attach will help you understand the memory useage and how QVS uses it.
Bill
To help users find verified answers, please don't forget to use the "Accept as Solution" button on any posts that helped you resolve your problem or question.