Unlock a world of possibilities! Login now and discover the exclusive benefits awaiting you.
- Qlik Community
- :
- All Forums
- :
- QlikView App Dev
- :
- Re: Conditional formatting in Pivot table not work...
- Subscribe to RSS Feed
- Mark Topic as New
- Mark Topic as Read
- Float this Topic for Current User
- Bookmark
- Subscribe
- Mute
- Printer Friendly Page
- Mark as New
- Bookmark
- Subscribe
- Mute
- Subscribe to RSS Feed
- Permalink
- Report Inappropriate Content
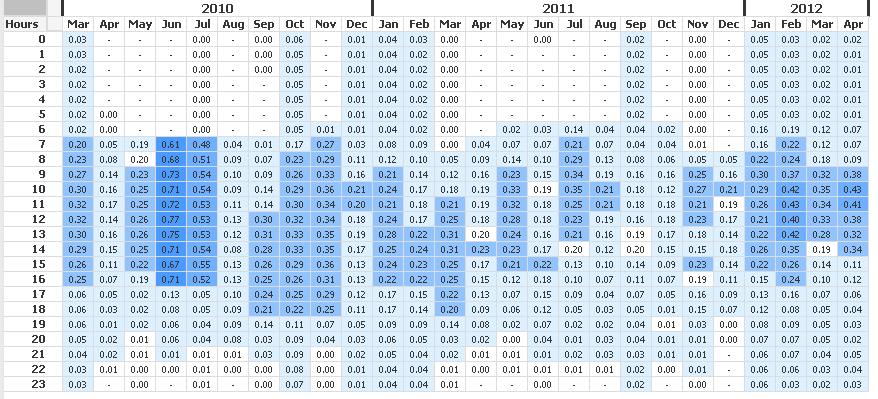
Conditional formatting in Pivot table not working propoerly
I have a Pivot table that displays bandwidth as a percentage 0-1. I have bands of colors 5 of them based on .2 intervals.
For whatever reason my formula is not treating the colors equally. If I use a single column straight table it works fine.
In some cases a value done not get any color.
Unfortunately I can not upload a QVW on this one since its a customer.
Bandwitdht ranges usually in increments of 1.6 but once summed up you get larger values but the max rang is 95 on any given hour.
vDayScale = 30.42
MaxBandWidthRange = 95
eBandWidth = (Sum(BandWidth) / vDayScale) / MaxBandWidthRange
If( $(eBandWidth) >= 1 , RGB(0,110,255) ,
If( $(eBandWidth) >= .8 and $(eBandWidth) <= .99 , RGB(40,140,255) ,
If( $(eBandWidth) >= .60 and $(eBandWidth) <= .79 , RGB(75,155,255) ,
If( $(eBandWidth) >= .40 and $(eBandWidth) <= .59 , RGB(110,175,255) ,
If( $(eBandWidth) >= .20 and $(eBandWidth) <= .39 , RGB(145,195,255) ,
If( $(eBandWidth) >= .01 and $(eBandWidth) <= .19 , RGB(221,240,255)
) ) ) ) ) )
- « Previous Replies
-
- 1
- 2
- Next Replies »
- Mark as New
- Bookmark
- Subscribe
- Mute
- Subscribe to RSS Feed
- Permalink
- Report Inappropriate Content
If( $(eBandWidth) >= 1 , RGB(0,110,255) ,
If( $(eBandWidth) >= .8 and $(eBandWidth) < 1 , RGB(40,140,255) ,
If( $(eBandWidth) >= .60 and $(eBandWidth) < .8 , RGB(75,155,255) ,
If( $(eBandWidth) >= .40 and $(eBandWidth) < .6 , RGB(110,175,255) ,
If( $(eBandWidth) >= .20 and $(eBandWidth) < .4 , RGB(145,195,255) ,
If( $(eBandWidth) >= .0 and $(eBandWidth) < .2 , RGB(221,240,255)
) ) ) ) ) )
- Mark as New
- Bookmark
- Subscribe
- Mute
- Subscribe to RSS Feed
- Permalink
- Report Inappropriate Content
Yeah I kept the % expression in place for the coloring.
But changed the main one to sum(BandWidth) to see the raw values accumaulated
- Mark as New
- Bookmark
- Subscribe
- Mute
- Subscribe to RSS Feed
- Permalink
- Report Inappropriate Content
That did the trick. Duh... simple tweak. Thanks!
- « Previous Replies
-
- 1
- 2
- Next Replies »