Unlock a world of possibilities! Login now and discover the exclusive benefits awaiting you.
- Qlik Community
- :
- All Forums
- :
- QlikView App Dev
- :
- Pivot table help
- Subscribe to RSS Feed
- Mark Topic as New
- Mark Topic as Read
- Float this Topic for Current User
- Bookmark
- Subscribe
- Mute
- Printer Friendly Page
- Mark as New
- Bookmark
- Subscribe
- Mute
- Subscribe to RSS Feed
- Permalink
- Report Inappropriate Content
Pivot table help
Hi All,
I have a requirement where I need to display a Pivot table having dollar values for the following values of one Dimension.
| Product1 | Amount |
| Sales | 76215.5 |
| Direct | 52044.86 |
| Indirect | 89573.6 |
| Marketing | 93449.1 |
| Direct | 6554.309 |
| Indirect | 19710.01 |
| Product2 | 41871.07 |
| R&D | 26531.7 |
| Direct | 48975.56 |
| Indirect | 48590.39 |
and so on.
The problem that QlikView sees the repeating values in the Dimension and clubs them all together, so my Pivot table looks like the following:
| Product1 | Amount |
| Sales | 49825.05 |
| Direct | 172573.6 |
| Indirect | 253675.1 |
| Marketing | 11201.1 |
| Product2 | 66014.51 |
| R&D | 86477.5 |
The values of Direct and Indirect are being summed up and shown in one row respectively.
How can I make QlikView show it as individual values in the Pivot chart??
Thanks,
Abhinava
- Mark as New
- Bookmark
- Subscribe
- Mute
- Subscribe to RSS Feed
- Permalink
- Report Inappropriate Content
I could be wrong, but if you're loading these tables with two instances of the same name I don't believe there is any way to differentiate them as Qlikview sees them as the same. If possible I would just say change the way they are labeled?
- Mark as New
- Bookmark
- Subscribe
- Mute
- Subscribe to RSS Feed
- Permalink
- Report Inappropriate Content
Correct, the fields with the same name in QlikView is the same field.
- Mark as New
- Bookmark
- Subscribe
- Mute
- Subscribe to RSS Feed
- Permalink
- Report Inappropriate Content
I agree but with some tricks maybe you can get the pivot or something similar to the request; my result is
Regards
- Mark as New
- Bookmark
- Subscribe
- Mute
- Subscribe to RSS Feed
- Permalink
- Report Inappropriate Content
You probably have a design problem. Can you show your load script?
- Mark as New
- Bookmark
- Subscribe
- Mute
- Subscribe to RSS Feed
- Permalink
- Report Inappropriate Content
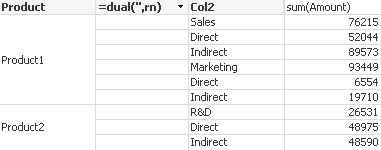
Tmp:
load recno() as rn, *;
LOAD * INLINE [
Product, Col2, Amount
Product1, Sales, 76215
Product1, Direct, 52044
Product1, Indirect, 89573
Product1, Marketing, 93449
Product1, Direct, 6554
Product1, Indirect, 19710
Product2, R&D, 26531
Product2, Direct, 48975
Product2, Indirect, 48590
];
- Mark as New
- Bookmark
- Subscribe
- Mute
- Subscribe to RSS Feed
- Permalink
- Report Inappropriate Content
See attached.
- Mark as New
- Bookmark
- Subscribe
- Mute
- Subscribe to RSS Feed
- Permalink
- Report Inappropriate Content
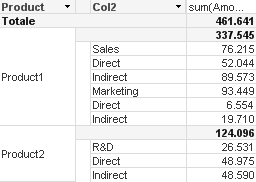
Or if you want just one dimension see this
- Mark as New
- Bookmark
- Subscribe
- Mute
- Subscribe to RSS Feed
- Permalink
- Report Inappropriate Content
Hi Ivan, try a dummy column as in my attachment