Unlock a world of possibilities! Login now and discover the exclusive benefits awaiting you.
- Qlik Community
- :
- All Forums
- :
- QlikView App Dev
- :
- Re: Problem with the dimension in combo chart
- Subscribe to RSS Feed
- Mark Topic as New
- Mark Topic as Read
- Float this Topic for Current User
- Bookmark
- Subscribe
- Mute
- Printer Friendly Page
- Mark as New
- Bookmark
- Subscribe
- Mute
- Subscribe to RSS Feed
- Permalink
- Report Inappropriate Content
Problem with the dimension in combo chart
Hi All,
In my application i have two types of data,one is inquiry Data and the other is Delivery data.Both are coming from different files.(Xl's).
for a particular month there will be inquiry and for a month there wil be delivery. This may or may not happen in the same month.The inquiry files and delivery files are connected based on the Inquiry Number.so for getting the total count frm inquiry i had taken Enq month as dimension and for getting the total count frm delivery taken delivery month
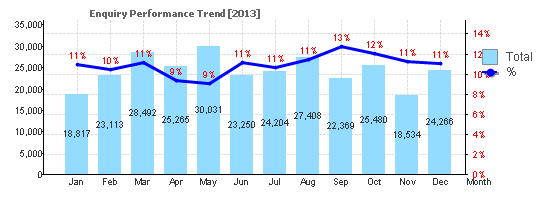
but the requirement is that for each month i need to show in a combo chart.,,the total count of inquiry as bar and the conversion [ count(delivery)/Count(Inquiry) *100]. since the Month field for each files are different the conversion ratio is not comin correct. is there any method to achieve this. Problem is with the dimension(Month)
Thnks in advance.
- Mark as New
- Bookmark
- Subscribe
- Mute
- Subscribe to RSS Feed
- Permalink
- Report Inappropriate Content
Hi,
you could change your script to have the same month dimension, so you have the combo chart working and when you select a month you have both the related inquiry and delivery.
To do it you have to remove the month from the two sources and create a new table with the key (inquiry number) and the month.