Unlock a world of possibilities! Login now and discover the exclusive benefits awaiting you.
- Qlik Community
- :
- All Forums
- :
- QlikView App Dev
- :
- Scatter chart legend disappears
- Subscribe to RSS Feed
- Mark Topic as New
- Mark Topic as Read
- Float this Topic for Current User
- Bookmark
- Subscribe
- Mute
- Printer Friendly Page
- Mark as New
- Bookmark
- Subscribe
- Mute
- Subscribe to RSS Feed
- Permalink
- Report Inappropriate Content
Scatter chart legend disappears
Hello QlikView professionals,
I have attached a qvw-file containing a simple example of a Scatter chart containing 2 dimensions (one of them is a cycling group) and 3 expressions.
The dimensions (especially the cycling group) shall be used as legend, the expressions shall NOT.
Now, whenever I add a 4th expression (e.g. to provide a custom pop-up label) my legend disappears completely!
You can reproduce this in the example qvw: if you select the chart and go into Properties->Expressions and set the 4th expression ("Pop-up") to "Enable", the Legend will disappear.
If you remove the check in "Enable" for this expression, the legend will show up again.
Is this a bug or am I doing something wrong?
Thanks for any help.
Andreas
- Mark as New
- Bookmark
- Subscribe
- Mute
- Subscribe to RSS Feed
- Permalink
- Report Inappropriate Content
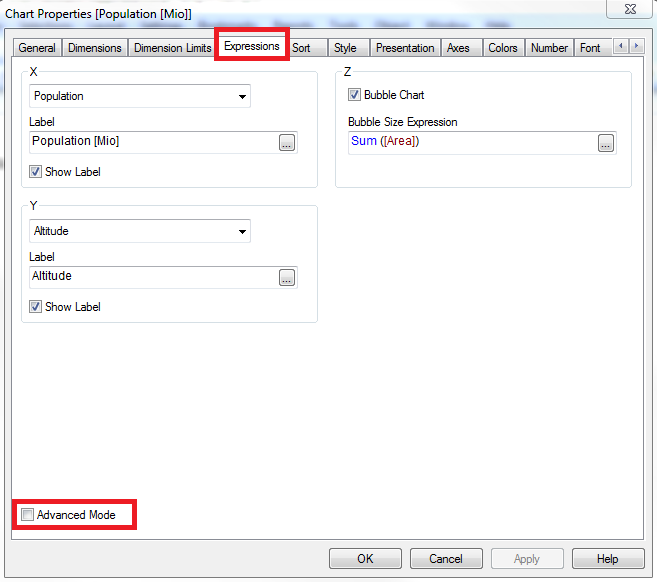
If you un-check "Advanced Mode", you'll see that you're only able to have 3 expressions:
- Mark as New
- Bookmark
- Subscribe
- Mute
- Subscribe to RSS Feed
- Permalink
- Report Inappropriate Content
http://community.qlik.com/message/449647
Nicole,
you are absolutely right, the Scatter Chart needs 2 or 3 expression for its functionality.
But it actually can have more expressions for special purposes (e.g. a custom pop-up).
Please have a look at the following discussion "Custom popup label on Scatter Chart" (see link).
Regards
Andreas
- Mark as New
- Bookmark
- Subscribe
- Mute
- Subscribe to RSS Feed
- Permalink
- Report Inappropriate Content
It seems to be a combination of the 2 dimensions with the 4 expressions. If you disable your fourth expression (the pop up one) the legend shows, or if you enable your pop up expression and remove one of the dimensions it also works. I don't know if this is a bug or if QlikView just doesn't allow >1 dimensions with >3 expressions. Sorry I can't be of more help, but good luck!
- Mark as New
- Bookmark
- Subscribe
- Mute
- Subscribe to RSS Feed
- Permalink
- Report Inappropriate Content
Nicole,
this is great, actually I have not been aware, that the legend appears again when I reduce the number of dimensions to 1!
In "real live" I was working with Scatter charts even having more than 2 dimensions.
I still consider this behavior as a bug (as there is no reason for a limit to one dimension), but this gives me a starting point for further investigation to work around this issue.
Thanks
Andreas
- Mark as New
- Bookmark
- Subscribe
- Mute
- Subscribe to RSS Feed
- Permalink
- Report Inappropriate Content
Hi - I'm running into the same issue - were you able to find a solution?
Many thanks!
newbie