Unlock a world of possibilities! Login now and discover the exclusive benefits awaiting you.
- Qlik Community
- :
- All Forums
- :
- QlikView App Dev
- :
- Re: How to put multiple expressions at the top of ...
- Subscribe to RSS Feed
- Mark Topic as New
- Mark Topic as Read
- Float this Topic for Current User
- Bookmark
- Subscribe
- Mute
- Printer Friendly Page
- Mark as New
- Bookmark
- Subscribe
- Mute
- Subscribe to RSS Feed
- Permalink
- Report Inappropriate Content
How to put multiple expressions at the top of bars chart
Hi everybody,
I have a bar chart with one dimension and two expressions. Each month has two bars, and here no problem at all. The problem occurs when I want to add two more expressions and put the value (a percentage in my case) at the top of EACH bar. The two new expressions are related to the other two: Expression 1 (integer value) is linked to Expression 3 (percentage), Expression 2 (integer value) is linked to Expression 4 (percentage).
What I was able to achieve is to show just one percentage of two, only the fourth. As I already wrote before, I would like to show also expression 3 at the top of the the bar 1, not only expression 4 at the top of bar 2.
Thanks in advance.
- Mark as New
- Bookmark
- Subscribe
- Mute
- Subscribe to RSS Feed
- Permalink
- Report Inappropriate Content
Instead of 4 expressions (one numeric and other one percentage) for 2 original expressions I think it may be wise to use a dual function that can hold both the numeric and percentage and can display on each expression.
- Mark as New
- Bookmark
- Subscribe
- Mute
- Subscribe to RSS Feed
- Permalink
- Report Inappropriate Content
I tried to use just two expressions with a dual function like this:
Dual(Num(count(IMPORTO)/count(IMPORTO),'#.00%'),count(IMPORTO))
Nothing is displayed at the top of bars, is there any settings to change in the chart properties?
- Mark as New
- Bookmark
- Subscribe
- Mute
- Subscribe to RSS Feed
- Permalink
- Report Inappropriate Content
Try working with a secondary axis for your two complementary expressions. It might work.
Good luck
Robert
- Mark as New
- Bookmark
- Subscribe
- Mute
- Subscribe to RSS Feed
- Permalink
- Report Inappropriate Content
Please use the expression like below.
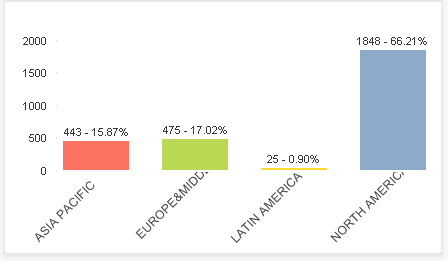
dual(count(IMPORTO)&' - '&num(count(IMPORTO)/Count(TOTAL IMPORTO),'#.##%'),Count(IMPORTO))
This will show the bar chart like below: Each bar will show the number as well as the % with the '-' as a separator
- Mark as New
- Bookmark
- Subscribe
- Mute
- Subscribe to RSS Feed
- Permalink
- Report Inappropriate Content
I solved changing two options in properties: I did checked the "Value on top..." option of both expressions which i had forgotten to do (together with bar option) and had to set default format expression in number properties of the graph.
Thank you guys. 