Unlock a world of possibilities! Login now and discover the exclusive benefits awaiting you.
- Qlik Community
- :
- All Forums
- :
- QlikView App Dev
- :
- Re: Re: creating visual report occupancy of wareho...
- Subscribe to RSS Feed
- Mark Topic as New
- Mark Topic as Read
- Float this Topic for Current User
- Bookmark
- Subscribe
- Mute
- Printer Friendly Page
- Mark as New
- Bookmark
- Subscribe
- Mute
- Subscribe to RSS Feed
- Permalink
- Report Inappropriate Content
creating visual report occupancy of warehouse area's
I am searching for a way to report the occupancy of the different area's in a warehouse. I am looking for a visual overview, so I would like to use a map of the warehouse and show the occupancy of the area in the picture (linked to a specific point in the picture). I put an example in the attachement.
Area occupancy
A 1
B 2
C 4
D 7
Now I am wondering how to solve this puzzle 
Kind regards,
Roland Huisman
- « Previous Replies
-
- 1
- 2
- Next Replies »
- Mark as New
- Bookmark
- Subscribe
- Mute
- Subscribe to RSS Feed
- Permalink
- Report Inappropriate Content
Hi Roland,
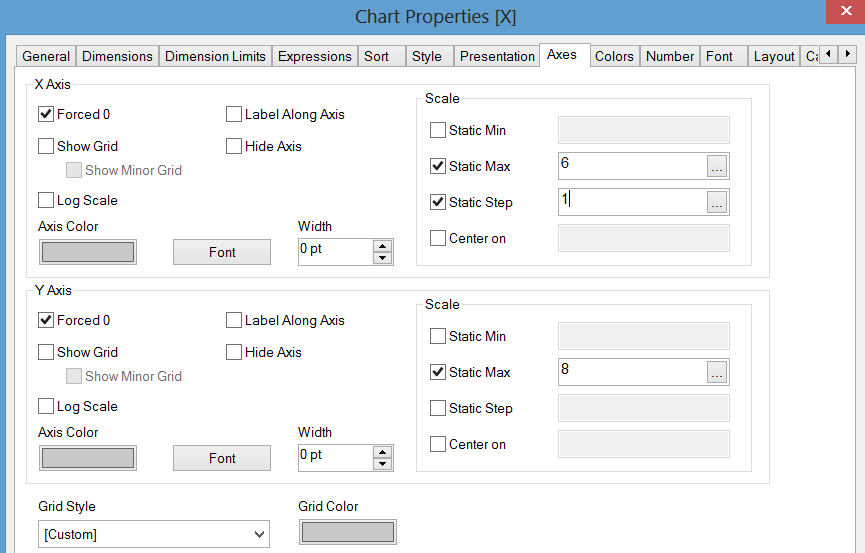
Try changing the static max for each until it looks correct, like below maybe
- Mark as New
- Bookmark
- Subscribe
- Mute
- Subscribe to RSS Feed
- Permalink
- Report Inappropriate Content
see attached
- Mark as New
- Bookmark
- Subscribe
- Mute
- Subscribe to RSS Feed
- Permalink
- Report Inappropriate Content
Thnx Allan,
This is a good base to continue my development of the dashboard!
Thanks to you an Nicole!!!
Met vriendelijke groet/with kind regards,
Roland Huisman
- Mark as New
- Bookmark
- Subscribe
- Mute
- Subscribe to RSS Feed
- Permalink
- Report Inappropriate Content
Hi Roland,
Can you mark if any of the answers were correct or helpful.
It will help other users find similar results
Regards and Best of Luck
Alan
- « Previous Replies
-
- 1
- 2
- Next Replies »