Unlock a world of possibilities! Login now and discover the exclusive benefits awaiting you.
- Qlik Community
- :
- All Forums
- :
- QlikView App Dev
- :
- Re: Static Min & Max Ajax issue?
- Subscribe to RSS Feed
- Mark Topic as New
- Mark Topic as Read
- Float this Topic for Current User
- Bookmark
- Subscribe
- Mute
- Printer Friendly Page
- Mark as New
- Bookmark
- Subscribe
- Mute
- Subscribe to RSS Feed
- Permalink
- Report Inappropriate Content
Static Min & Max Ajax issue?
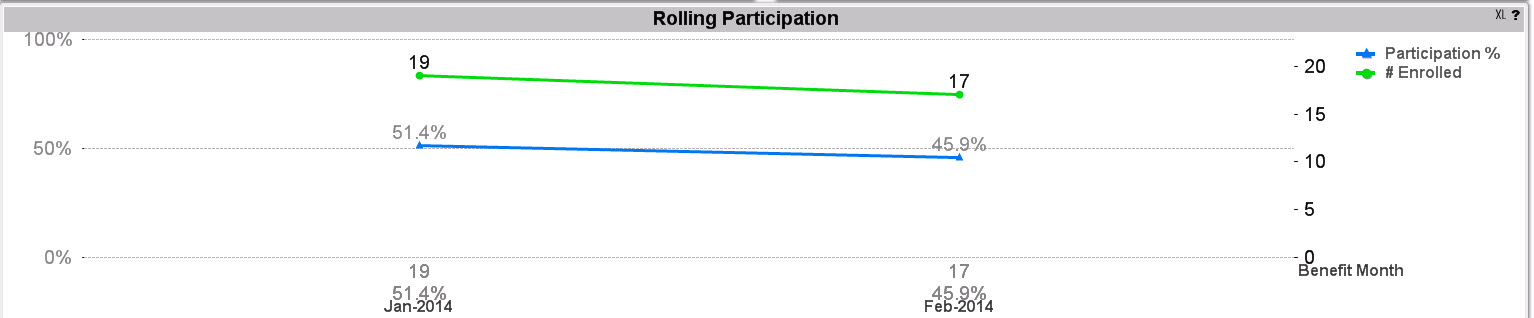
I have a simple line graph with two expressions.
The graph has a static scale of 0 to 1 on the left expression (formatted as %), and a dynamic scale of 0 to max on the right one (just an integer).
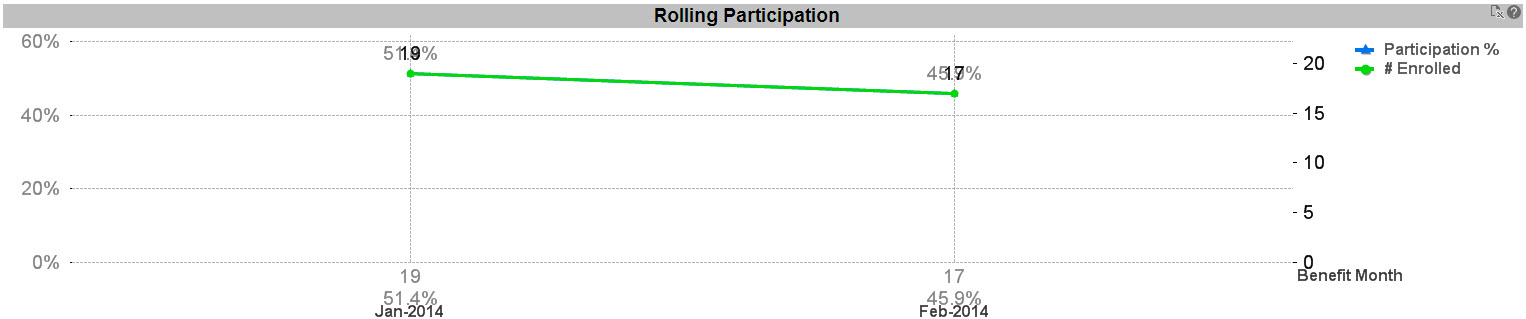
It works perfect during development in Qlikview, but the published app on the server synchronizes both axes to dynamic scale of 0 - max, which means the two lines are identical.
Is this another Ajax problem, or am I doing something wrong?
Here is the graph in Qlikview:
Here is the graph on the web:
- Mark as New
- Bookmark
- Subscribe
- Mute
- Subscribe to RSS Feed
- Permalink
- Report Inappropriate Content
Hey Joel,
My guess is that it could be a sizing issue. Did you try sizing the chart in Ajax a little and see if it makes a difference.Increase the vertical length maybe?
Thanks
AJ