Unlock a world of possibilities! Login now and discover the exclusive benefits awaiting you.
- Qlik Community
- :
- All Forums
- :
- QlikView App Dev
- :
- Text in Chart: Display Last X-axis Data Point
- Subscribe to RSS Feed
- Mark Topic as New
- Mark Topic as Read
- Float this Topic for Current User
- Bookmark
- Subscribe
- Mute
- Printer Friendly Page
- Mark as New
- Bookmark
- Subscribe
- Mute
- Subscribe to RSS Feed
- Permalink
- Report Inappropriate Content
Text in Chart: Display Last X-axis Data Point
Hi,
I am brand new to this so I apologize if this has already been posted - I've read through a couple posts already and have not been able to understand to solve my problem.
I am trying to get YTD to show the most recent value - 88% (only value, not sum). Originally I had put in the Text in Chart:
='YTD:'&only(ServiceCoverage)
But I realized without selecting the month, it does not know which value to choose, but I would like it to display the last data point on the x-axis that contains data. Going forward in 2014, in February, we will be talking about the January data - where only January would have data and the rest of the year will be 0... going onto March, we will have January and Feb data, but I only want it to display Feb data.
I tried using the max function too, but it returns the max Service Coverage point (which in this case gets me the December number) but I have other charts where the last data point is not the highest value. Is there an expression to pull the Y-axis value for the max X-axis value?
The other solutions I have read involved pulling from today's date or choosing a specific date as today's date, and I would like to stay away from that if possible - I just want the last x-axis Y-value (that is not 0) to display.
As I have the personal edition, I am unable to view other .qvw files and would appreciate the expression in text on the forum  .
.
Thanks!
- « Previous Replies
-
- 1
- 2
- Next Replies »
Accepted Solutions
- Mark as New
- Bookmark
- Subscribe
- Mute
- Subscribe to RSS Feed
- Permalink
- Report Inappropriate Content
It has to do with your date format. The date() function isn't needed inside the set analysis:
='YTD:'&only({<Date={'$(=max(Date))'}>}[Service Coverage - All (%)])
- Mark as New
- Bookmark
- Subscribe
- Mute
- Subscribe to RSS Feed
- Permalink
- Report Inappropriate Content
- Mark as New
- Bookmark
- Subscribe
- Mute
- Subscribe to RSS Feed
- Permalink
- Report Inappropriate Content
Hi Nicole,
In the text in chart section, I inserted the below, and I got a dash in return (lost the 'YTD:' as well)... do you know what I may be doing wrong?
='YTD:'& if(Month = $(=max(Month)),only([Service Coverage - All (%)]),")
- Mark as New
- Bookmark
- Subscribe
- Mute
- Subscribe to RSS Feed
- Permalink
- Report Inappropriate Content
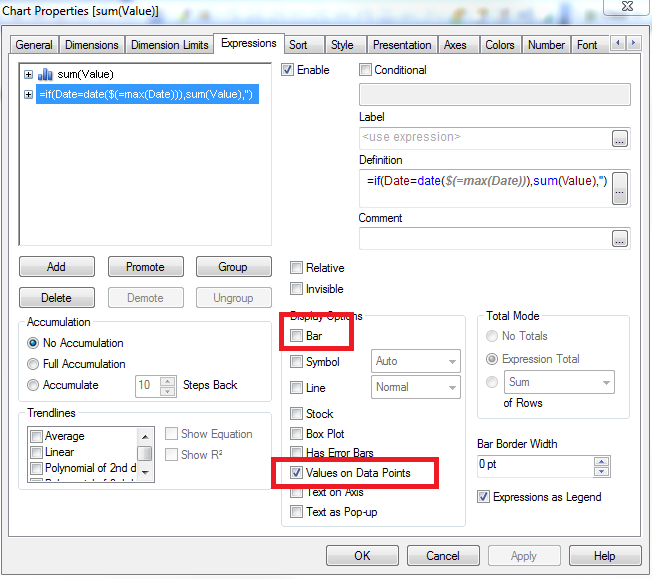
It shouldn't be Text in Chart, it should be a second expression. Just uncheck bar and check Values on Data Points:
- Mark as New
- Bookmark
- Subscribe
- Mute
- Subscribe to RSS Feed
- Permalink
- Report Inappropriate Content
Hi Nicole,
I was using Text In Chart because under the heading of every chart title, I am hoping to be able to display the YTD: value (as opposed to on top of the bar) -- would I be able to reference this point in Text in Chart?
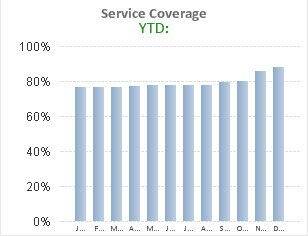
As well, I tried the instructions above to have it display in the chart (in case the YTD: won't work) and I ended up with dashes above every point. I've attached an example.
I greatly appreciate your help!
- Mark as New
- Bookmark
- Subscribe
- Mute
- Subscribe to RSS Feed
- Permalink
- Report Inappropriate Content
I didn't realize you wanted it right at the top of the chart. You can do that using a formula like this:
=sum({<Date={'$(=date(max(Date)))'}>}Value)
The problem with your data is that month is just a text field, so there's no way to take a max() of it. I would suggest having an actual Date field instead.
- Mark as New
- Bookmark
- Subscribe
- Mute
- Subscribe to RSS Feed
- Permalink
- Report Inappropriate Content
Could you instruct me as how to change it to an actual Date field? Thanks so much!
- Mark as New
- Bookmark
- Subscribe
- Mute
- Subscribe to RSS Feed
- Permalink
- Report Inappropriate Content
Well it's just a month name, how am I supposed to know what year to associate it to? What day to associate it to? Don't you have this information in your file somewhere?
- Mark as New
- Bookmark
- Subscribe
- Mute
- Subscribe to RSS Feed
- Permalink
- Report Inappropriate Content
Ah ok - so I should edit it straight from the source, as opposed to doing any manipulations in Qlikview.. I wasn't sure if I was supposed to assign anything within the program.
Thanks! I will try your formula after I've fixed up my file.
- Mark as New
- Bookmark
- Subscribe
- Mute
- Subscribe to RSS Feed
- Permalink
- Report Inappropriate Content
Don't get me wrong--you could manipulate it in QlikView. But if you have multiple years of data and only a month field, how would QlikView know what years to associate which rows to? It's easier if the data model is clean than trying to force it into QV.
- « Previous Replies
-
- 1
- 2
- Next Replies »