Unlock a world of possibilities! Login now and discover the exclusive benefits awaiting you.
- Qlik Community
- :
- All Forums
- :
- QlikView App Dev
- :
- Re: building a Year comparison graphic
- Subscribe to RSS Feed
- Mark Topic as New
- Mark Topic as Read
- Float this Topic for Current User
- Bookmark
- Subscribe
- Mute
- Printer Friendly Page
- Mark as New
- Bookmark
- Subscribe
- Mute
- Subscribe to RSS Feed
- Permalink
- Report Inappropriate Content
building a Year comparison graphic
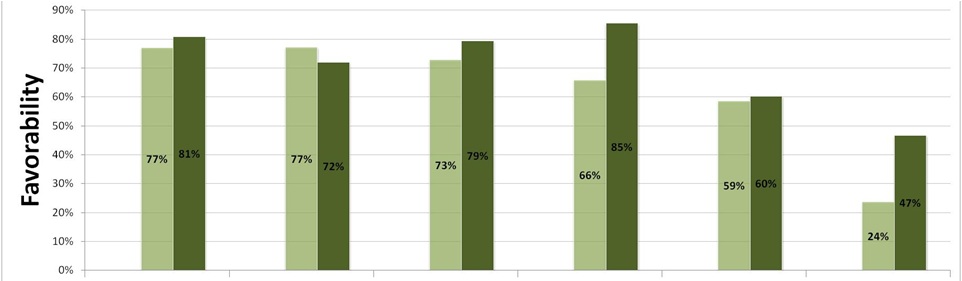
Hi, I am trying to create a graph that I can see the evolution 2012/2013 in some question. I am trying to build a chart like this:
Problem is, each question is a column, and I am trying to build like this and the closer I get is this:
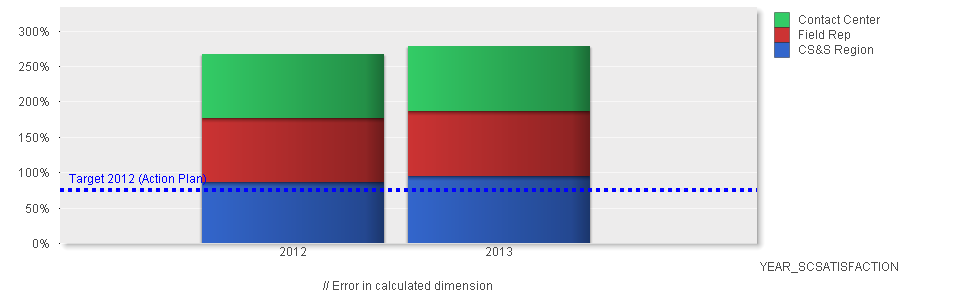
how can I change this graph into the first one??
- Tags:
- qlikview_scripting
- « Previous Replies
-
- 1
- 2
- Next Replies »
- Mark as New
- Bookmark
- Subscribe
- Mute
- Subscribe to RSS Feed
- Permalink
- Report Inappropriate Content
Sure, i'll attach a .qvw here, just a minute
- Mark as New
- Bookmark
- Subscribe
- Mute
- Subscribe to RSS Feed
- Permalink
- Report Inappropriate Content
Você é brasileiro 
- Mark as New
- Bookmark
- Subscribe
- Mute
- Subscribe to RSS Feed
- Permalink
- Report Inappropriate Content
I think Clever will help you with that.
- Mark as New
- Bookmark
- Subscribe
- Mute
- Subscribe to RSS Feed
- Permalink
- Report Inappropriate Content
here it's the file...
- Mark as New
- Bookmark
- Subscribe
- Mute
- Subscribe to RSS Feed
- Permalink
- Report Inappropriate Content
Thank you Carlos! I think Clever will be able to help me finishing this task.
- Mark as New
- Bookmark
- Subscribe
- Mute
- Subscribe to RSS Feed
- Permalink
- Report Inappropriate Content
Julio,
Here´s your file and the final result.
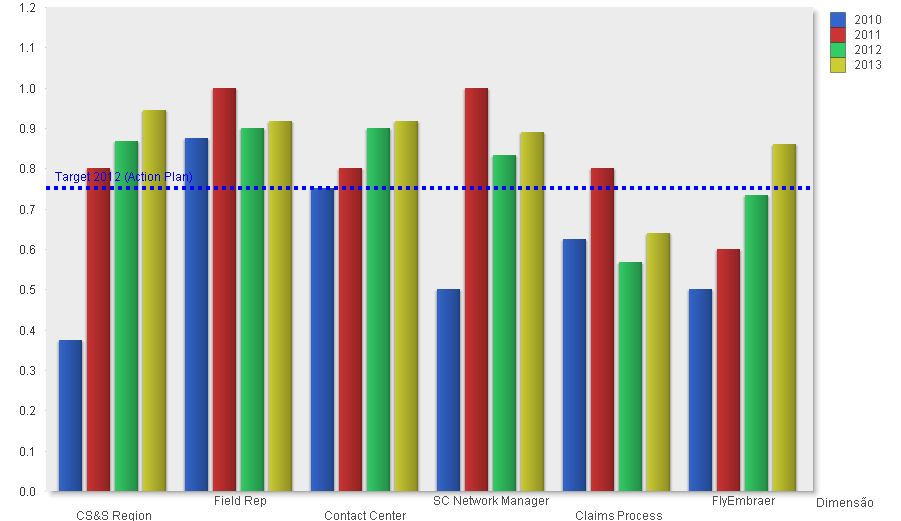
I´ve done a "quick ´n dirty" example, because you don´t have a another dimension to include into that graph.
I´ve created a calculated dimension to generate your dimension (FlyEmbraer, Claims and so on). A much better approach is having this into your tables.
- Mark as New
- Bookmark
- Subscribe
- Mute
- Subscribe to RSS Feed
- Permalink
- Report Inappropriate Content
That's exactly what I wanted to do! thank you alot!
- Mark as New
- Bookmark
- Subscribe
- Mute
- Subscribe to RSS Feed
- Permalink
- Report Inappropriate Content
If you want to improve that app, we can discuss it by direct mail or clever@clever.com.br
- Mark as New
- Bookmark
- Subscribe
- Mute
- Subscribe to RSS Feed
- Permalink
- Report Inappropriate Content
thank you man! I always wondered how I could do that!
- « Previous Replies
-
- 1
- 2
- Next Replies »