Unlock a world of possibilities! Login now and discover the exclusive benefits awaiting you.
- Qlik Community
- :
- All Forums
- :
- QlikView App Dev
- :
- Re: Mekko chart
- Subscribe to RSS Feed
- Mark Topic as New
- Mark Topic as Read
- Float this Topic for Current User
- Bookmark
- Subscribe
- Mute
- Printer Friendly Page
- Mark as New
- Bookmark
- Subscribe
- Mute
- Subscribe to RSS Feed
- Permalink
- Report Inappropriate Content
Mekko chart
I am unfamiliar with Mekko charts, but think this may be the chart that I need to use to graph volume vs cost.
For eg. I want to chart volume vs cost for a number of plants. The plant is not the lowest level of data, but the relevant level that I want to show.
Attached is a screen shot of the required chart that was done in excel. This shows cumulative volume on the x-axis and costs on the y-axis.
Any help would be greatly appreciated, and a qvw example would be fantastic.
Thanks
- Mark as New
- Bookmark
- Subscribe
- Mute
- Subscribe to RSS Feed
- Permalink
- Report Inappropriate Content
You can reproduce something similar with a Mekko chart. See attached. I'm not sure how to get the Volume scale to show along the bottom though.
-Rob
- Mark as New
- Bookmark
- Subscribe
- Mute
- Subscribe to RSS Feed
- Permalink
- Report Inappropriate Content
Hi Rob,
Instead of the volume scale along the bottom, is it possible to show the volume as a value on each of the bars (either individual volumes or accumulated)?
Thanks
- Mark as New
- Bookmark
- Subscribe
- Mute
- Subscribe to RSS Feed
- Permalink
- Report Inappropriate Content
I think, with mekko its not possible.
You can try a bar chart with thin bars without gaps between.
- Mark as New
- Bookmark
- Subscribe
- Mute
- Subscribe to RSS Feed
- Permalink
- Report Inappropriate Content
The decoration options for Mekko charts seem to be very limited. I can't find a way to get useful volume numbers to display on the chart.
-Rob
- Mark as New
- Bookmark
- Subscribe
- Mute
- Subscribe to RSS Feed
- Permalink
- Report Inappropriate Content
Dear Rob,
IS there a way to display the legends inside the Mekko chart?
THank you in advance!
- Mark as New
- Bookmark
- Subscribe
- Mute
- Subscribe to RSS Feed
- Permalink
- Report Inappropriate Content
it will show up if you have more than 2 expressions...
1st expression will decide your Width of the bar..
2nd Expression will decide the Height
3rd expression will be stacked to your 2nd based on the dimension..
- Mark as New
- Bookmark
- Subscribe
- Mute
- Subscribe to RSS Feed
- Permalink
- Report Inappropriate Content
Dear Phaneendra,
I tried the suggestions.
Still not being able to display the legends inside the chart.
Attached is the example.
Thanks a ton in advance!
- Mark as New
- Bookmark
- Subscribe
- Mute
- Subscribe to RSS Feed
- Permalink
- Report Inappropriate Content
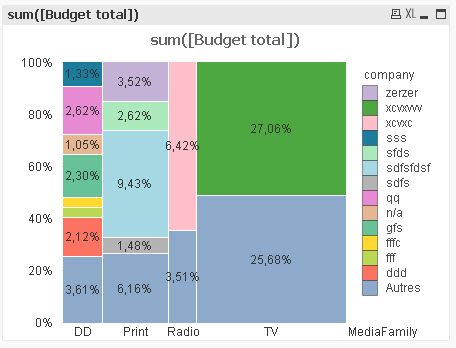
this is not what you are expecting? i mean legend for Company..
- Mark as New
- Bookmark
- Subscribe
- Mute
- Subscribe to RSS Feed
- Permalink
- Report Inappropriate Content
is this only to show the analysis between Volume vs Cost?
Or we can use them for other analysis