Unlock a world of possibilities! Login now and discover the exclusive benefits awaiting you.
- Qlik Community
- :
- All Forums
- :
- QlikView App Dev
- :
- Re: Modeling one to many relationships
- Subscribe to RSS Feed
- Mark Topic as New
- Mark Topic as Read
- Float this Topic for Current User
- Bookmark
- Subscribe
- Mute
- Printer Friendly Page
- Mark as New
- Bookmark
- Subscribe
- Mute
- Subscribe to RSS Feed
- Permalink
- Report Inappropriate Content
Modeling one to many relationships
Hi, I am new to Qlikview and am trying to model survey results data. the problem is several of my questions have multiple answers and so do not fit into the paradigm demonstrated in the 'How people use firefox app' demo app. I want to be able to show characteristics amongst respondents based on answers provided for various questions in the survey. Any help would be greatly appreciated!
- Mark as New
- Bookmark
- Subscribe
- Mute
- Subscribe to RSS Feed
- Permalink
- Report Inappropriate Content
Hi,
Do you have a little sample app to attach to this question? Would make replying a lot easier
- Mark as New
- Bookmark
- Subscribe
- Mute
- Subscribe to RSS Feed
- Permalink
- Report Inappropriate Content
I have a similar problem, with data stored in separate Excel files.
Questions and response options are along the lines shown below
Question: Where do you think pollution levels will be in 1 year for the following regions: a) Europe, b) US, c) SE Asia, d) LATAM ?
Response options:
i) Significantly higher
ii) Moderately higher
iii) About the same
iv) Moderately lower
v) Significantly lower
I get % response rates for each option, e.g. as below: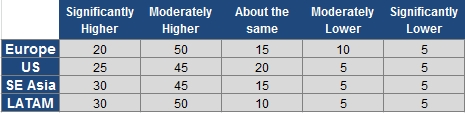
If anyone has any experience using QlikView to visualise series of survey questions as above, with historical look back, I would be very greatful for any insight.