Unlock a world of possibilities! Login now and discover the exclusive benefits awaiting you.
- Qlik Community
- :
- All Forums
- :
- QlikView App Dev
- :
- Master Calender + line chart
- Subscribe to RSS Feed
- Mark Topic as New
- Mark Topic as Read
- Float this Topic for Current User
- Bookmark
- Subscribe
- Mute
- Printer Friendly Page
- Mark as New
- Bookmark
- Subscribe
- Mute
- Subscribe to RSS Feed
- Permalink
- Report Inappropriate Content
Master Calender + line chart
Hi all,
I have a problem with my master calender and my line chart. I have a master calender for a couple of years and i created a line chart that shows me sum(profit) for each year and calenderweek and weekday. calendarweek and weekday are one dimension like cw & ' ' & wd.
everything is showing correctly except on dates where i dont have a profit value. meaning on the first of may over here it is always a holiday so we have no profit. but my dimension is always calendarweek + weekday so so for example calenderweek 17 Monday was one in 2009 the first of may and in 2010 ist was the second of may(has profit) so my lines are not showing 0 for 2009 it is jsut being ignored and jumps automaticly to the next date.
can someone help me how i can fix this?
my tables are:
Master claender with the columns Date, Weekday, Week, year, month
and the table:
movement with the columns Date (connection to master calender) , profit
and movement has only lines for the dates where we had profit
regards,
MT
- « Previous Replies
-
- 1
- 2
- Next Replies »
- Mark as New
- Bookmark
- Subscribe
- Mute
- Subscribe to RSS Feed
- Permalink
- Report Inappropriate Content
Go to presentation tab and untick Supress Zero Values
- Mark as New
- Bookmark
- Subscribe
- Mute
- Subscribe to RSS Feed
- Permalink
- Report Inappropriate Content
Hi Magdalena,
it is a bit tricky and you will have to do a bit of trial-and-error here:
=> It is quite hard to get Qlikview to display something that is not available.
- That said, the next important questions to ask yourself would be:
=> What format is your base_data?
=> Do you have a field for that day and simply no value in it (blank field)
or is there no field available for that day?
=> How is your fact_table (for the chart) linked to the calendar?
=> Which fields are you using as dimension? Those from the fact_table itself or from the calendar
(the fact_table might not have a field for that day, but the master_calendar should, no?)
=> You might need a "dummy formula" (hard-coded as 0) just to force QlikView to display the chart_area when there
is no value to display.
HTH
Best regards,
DataNibbler
- Mark as New
- Bookmark
- Subscribe
- Mute
- Subscribe to RSS Feed
- Permalink
- Report Inappropriate Content
ok the dimensions in the line chart are from my master calender. so that shouldnt be the issue right?? and my master calender are linked through the date field (_DATE) how can I create dummy values??
When i use a table object and I select a date wich has no profit it still schows a line in movement with only a value in the date field

- Mark as New
- Bookmark
- Subscribe
- Mute
- Subscribe to RSS Feed
- Permalink
- Report Inappropriate Content
as your Calender is directly linked with Dates in Table, so it must reflect the value 0. Because you are already creating a dummy date.
Is problem arises only with the Month start or it reflects on all the days where you don't have values of Profit.
- Mark as New
- Bookmark
- Subscribe
- Mute
- Subscribe to RSS Feed
- Permalink
- Report Inappropriate Content
if i create a textbox and sum(profit) for the selected date it shows me 0 but in my line chart i dont get the 0 values displayed.

the dimension on the x-achis is week + weekday. so on 18 Mi für the year 2013 I should have 0.
- Mark as New
- Bookmark
- Subscribe
- Mute
- Subscribe to RSS Feed
- Permalink
- Report Inappropriate Content
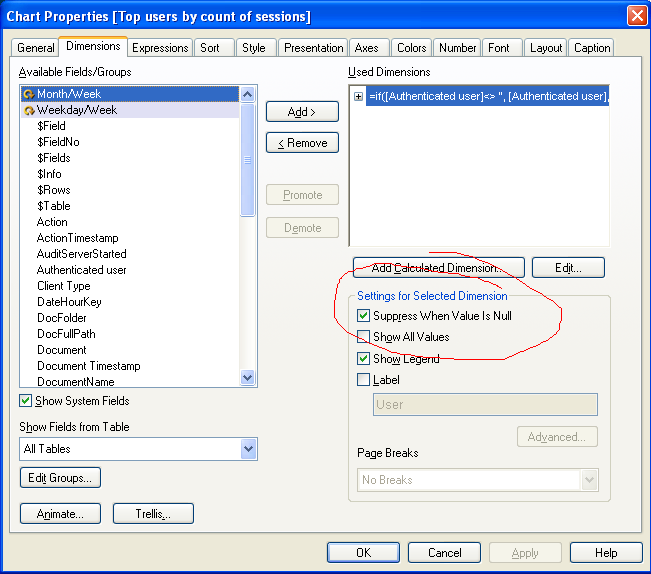
Sorry, but have you unchecked the 'suppress where value is null' as suggested above?
- Mark as New
- Bookmark
- Subscribe
- Mute
- Subscribe to RSS Feed
- Permalink
- Report Inappropriate Content
Hi!
The line chart will only show you the 0 if there is a value on this date. Otherwise the line will go from monday to wednesday.
Add on formula tab at presentation "points" to see that there is a value.
Regads
Martin
- Mark as New
- Bookmark
- Subscribe
- Mute
- Subscribe to RSS Feed
- Permalink
- Report Inappropriate Content
ok but how can i create this 0 instead of null for that date? cause where in the database there is no profit for this day.
and yes suppress when value is null is unchecked
- Mark as New
- Bookmark
- Subscribe
- Mute
- Subscribe to RSS Feed
- Permalink
- Report Inappropriate Content
Check enclosed file...
To make NULL to 0...
try below..
IF(ISNULL(Sales), 0, Sales) as Sales
But in your database there should not be any NULL values as the Dates themselves are not exists...!!!
- « Previous Replies
-
- 1
- 2
- Next Replies »