Unlock a world of possibilities! Login now and discover the exclusive benefits awaiting you.
- Qlik Community
- :
- Discover
- :
- About
- :
- Water Cooler
- :
- Re: value in the bar and sum on the bar
- Subscribe to RSS Feed
- Mark Topic as New
- Mark Topic as Read
- Float this Topic for Current User
- Bookmark
- Subscribe
- Mute
- Printer Friendly Page
- Mark as New
- Bookmark
- Subscribe
- Mute
- Subscribe to RSS Feed
- Permalink
- Report Inappropriate Content
value in the bar and sum on the bar
Hi all
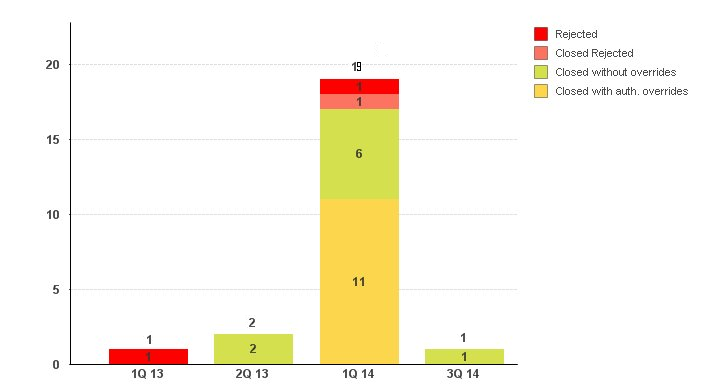
I have this chart:

Is it possibile having the sum above every bar?
thanks in advance
Luca
- « Previous Replies
-
- 1
- 2
- Next Replies »
- Mark as New
- Bookmark
- Subscribe
- Mute
- Subscribe to RSS Feed
- Permalink
- Report Inappropriate Content
Hi Gysbert.
I'm sorry but I need your help.
Please, take a look at my example. Why I can't replicate your chart? numbers on the axis are replicated, why?
grazie mille
luca
- Mark as New
- Bookmark
- Subscribe
- Mute
- Subscribe to RSS Feed
- Permalink
- Report Inappropriate Content
Two reasons mainly. To begin with there's no [Applicable set of rules] with a record for every QuarterIngresso value. That can be fixed by adding some dummy records:
join(TAB_VIEW_CRR)
load
FieldValue('QuarterIngresso', recNo()) as QuarterIngresso,
'Ancillary services' as [Applicable set of rules]
AutoGenerate(FieldValueCount('QuarterIngresso'));
The next problem is that enabling the horizontal scrollbar creates a gap between the counts below the axis and the QuarterIngresso labels. I haven't found a way around this.
Also take a look at the expression for the text color of the second expression (click on the + in front of the expression and select Text Color). This makes sure that only one line of count values is shown as text on axis.
talk is cheap, supply exceeds demand
- Mark as New
- Bookmark
- Subscribe
- Mute
- Subscribe to RSS Feed
- Permalink
- Report Inappropriate Content
Gysbert,
thank you.
your solution is valid but due to the gap between the counts and the QuarterIngresso labels, and to the fact that seems impossibile even align the counts, this solution is not good for me.
I'm a beginner, I have a lot to learn..
ciao e grazie
luca
- « Previous Replies
-
- 1
- 2
- Next Replies »