Unlock a world of possibilities! Login now and discover the exclusive benefits awaiting you.
- Qlik Community
- :
- All Forums
- :
- QlikView App Dev
- :
- Re: Line Chart with dynamic selection displaying t...
- Subscribe to RSS Feed
- Mark Topic as New
- Mark Topic as Read
- Float this Topic for Current User
- Bookmark
- Subscribe
- Mute
- Printer Friendly Page
- Mark as New
- Bookmark
- Subscribe
- Mute
- Subscribe to RSS Feed
- Permalink
- Report Inappropriate Content
Line Chart with dynamic selection displaying two series
Hello fellows,
I have a data table with the attributes (date, X, Y):
Date, X, Y
8-Feb-14 1 0.4343
8-Feb-14 2 0.4311
8-Feb-14 3 4343
8-Feb-14 4 65
8-Feb-14 5 67.5
7-Feb-14 1 0.555
7-Feb-14 2 0.656
7-Feb-14 3 111
7-Feb-14 4 22
7-Feb-14 5 657.5
The user can select a date.
Now I'm trying to build a line chart displaying two series of (x,y) values, one for selected date and one for previous date. While building first series was quite obvious, creating an expression for second one is not straightforward.
The (potential) algorithm is to:
- get selected date
- calculate previous date (if not available, try one before)
- get (x,y) values for previous date
Any suggestions, please?
- Mark as New
- Bookmark
- Subscribe
- Mute
- Subscribe to RSS Feed
- Permalink
- Report Inappropriate Content
For your second expression, try something like:
sum({< [Date]= {"$(=date(max([Date])-1))"}>}
- Mark as New
- Bookmark
- Subscribe
- Mute
- Subscribe to RSS Feed
- Permalink
- Report Inappropriate Content
Luis,
What if I don't need 'sum' of values, but rather values themselves?
- Mark as New
- Bookmark
- Subscribe
- Mute
- Subscribe to RSS Feed
- Permalink
- Report Inappropriate Content
could you share a snapshot of your actual line chart, with the current selection date expression?
- Mark as New
- Bookmark
- Subscribe
- Mute
- Subscribe to RSS Feed
- Permalink
- Report Inappropriate Content
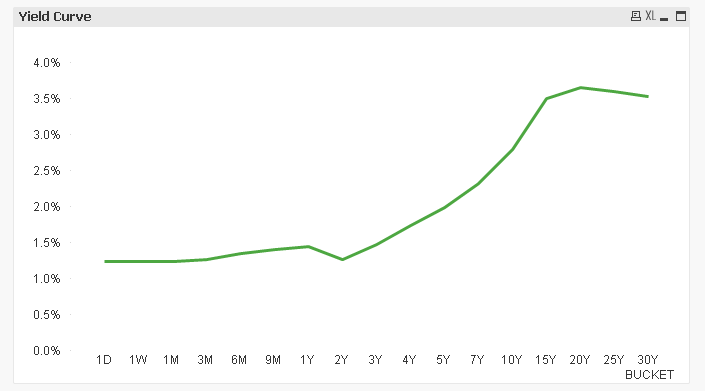
Chart displaying (x,y) (interest rate, maturity) data:
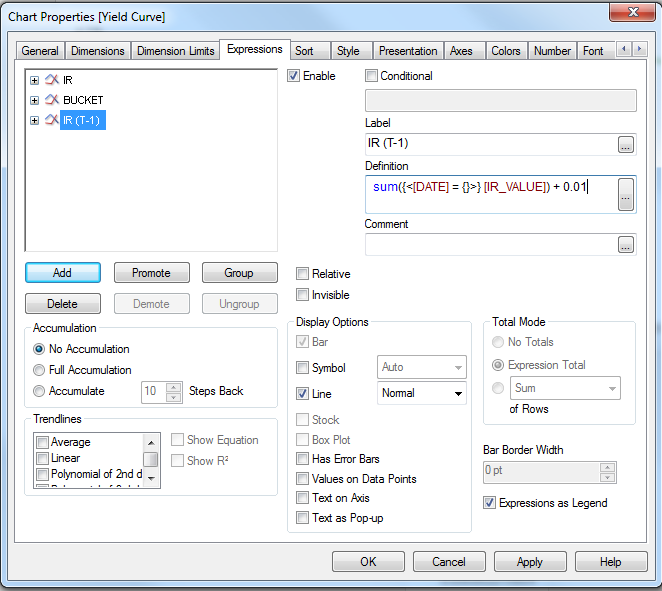
Expression I'm trying to build: