Unlock a world of possibilities! Login now and discover the exclusive benefits awaiting you.
- Qlik Community
- :
- All Forums
- :
- QlikView App Dev
- :
- Re: Re: Re: How to make selected Line chart turn G...
- Subscribe to RSS Feed
- Mark Topic as New
- Mark Topic as Read
- Float this Topic for Current User
- Bookmark
- Subscribe
- Mute
- Printer Friendly Page
- Mark as New
- Bookmark
- Subscribe
- Mute
- Subscribe to RSS Feed
- Permalink
- Report Inappropriate Content
How to make selected Line chart turn Green and the rest not selected turn Gray ?
Hi All
I try to do the recent blog post on line chart trick , which is very hot. I have follow the procedure , but i am not able to make it work. Hope some one can advise me.
In my next post i will post my QV doc.
Paul
Accepted Solutions
- Mark as New
- Bookmark
- Subscribe
- Mute
- Subscribe to RSS Feed
- Permalink
- Report Inappropriate Content
When I open your example and replace the expression with this:
sum({$<year = {">=$(=max(year),4)"}, month = {"<=$(=max({<year={$(=max(year))}>} month))"},GROUP_CLASS=>}sales/1000)
I get this result:
Is this not the desired functionality?
- Mark as New
- Bookmark
- Subscribe
- Mute
- Subscribe to RSS Feed
- Permalink
- Report Inappropriate Content
Hi All
Enclosed my QV Doc.
Paul
- Mark as New
- Bookmark
- Subscribe
- Mute
- Subscribe to RSS Feed
- Permalink
- Report Inappropriate Content
You just need to ignore the GROUP_CLASS field in your expression:
sum({$<year = {">=$(=max(year),4)"},SOURCE = {"TDSS"}, month = {"<=$(=max({<year={$(=max(year))}>} month))"},GROUP_CLASS=>}sales/1000)
Hope that helps,
Steve
- Mark as New
- Bookmark
- Subscribe
- Mute
- Subscribe to RSS Feed
- Permalink
- Report Inappropriate Content
You may also want to sort on your second dimension to put the green lines on top of the grey ones. Set the sort order to be by Expression and enter this as the expression:
=sum({$<year = {">=$(=max(year),4)"},SOURCE = {"TDSS"}, month = {"<=$(=max({<year={$(=max(year))}>} month))"}>}sales)
Set the sort order to be Ascending.
- Mark as New
- Bookmark
- Subscribe
- Mute
- Subscribe to RSS Feed
- Permalink
- Report Inappropriate Content
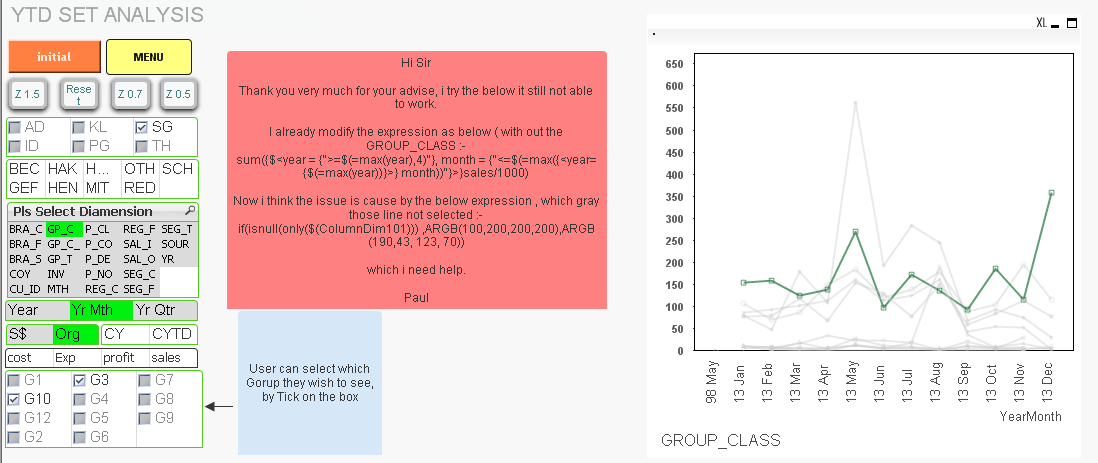
Hi Sir
Thank you very much for your advise, i try the below it still not able to work.
I already modify the expression as below ( with out the GROUP_CLASS :-
sum({$<year = {">=$(=max(year),4)"}, month = {"<=$(=max({<year={$(=max(year))}>} month))"}>}sales/1000)
Now i think the issue is cause by the below expression , which gray those line not selected :-
if(isnull(only($(ColumnDim101))) ,ARGB(100,200,200,200),ARGB(190,43, 123, 70))
which i need help.
Paul
- Mark as New
- Bookmark
- Subscribe
- Mute
- Subscribe to RSS Feed
- Permalink
- Report Inappropriate Content
The expression without the GROUP_CLASS is purely for the sort as you want the rows that are selected to show on top of the grey lines. You need it with the GROUP_CLASS= for the expression.
Apologies for the confusion.
- Mark as New
- Bookmark
- Subscribe
- Mute
- Subscribe to RSS Feed
- Permalink
- Report Inappropriate Content
Hi Steve
Now my issue is not on sort , my issue is when i select G1 , it will display G1 as green line , but all the gray line does not display. any idea ?
Paul
- Mark as New
- Bookmark
- Subscribe
- Mute
- Subscribe to RSS Feed
- Permalink
- Report Inappropriate Content
When I open your example and replace the expression with this:
sum({$<year = {">=$(=max(year),4)"}, month = {"<=$(=max({<year={$(=max(year))}>} month))"},GROUP_CLASS=>}sales/1000)
I get this result:
Is this not the desired functionality?
- Mark as New
- Bookmark
- Subscribe
- Mute
- Subscribe to RSS Feed
- Permalink
- Report Inappropriate Content
Hi Steve
Many thank , finally it working fine.
Paul