Unlock a world of possibilities! Login now and discover the exclusive benefits awaiting you.
- Qlik Community
- :
- All Forums
- :
- QlikView App Dev
- :
- Re: why my line chart only work when diamension = ...
- Subscribe to RSS Feed
- Mark Topic as New
- Mark Topic as Read
- Float this Topic for Current User
- Bookmark
- Subscribe
- Mute
- Printer Friendly Page
- Mark as New
- Bookmark
- Subscribe
- Mute
- Subscribe to RSS Feed
- Permalink
- Report Inappropriate Content
why my line chart only work when diamension = GROUP_CLASS ?
Hi All
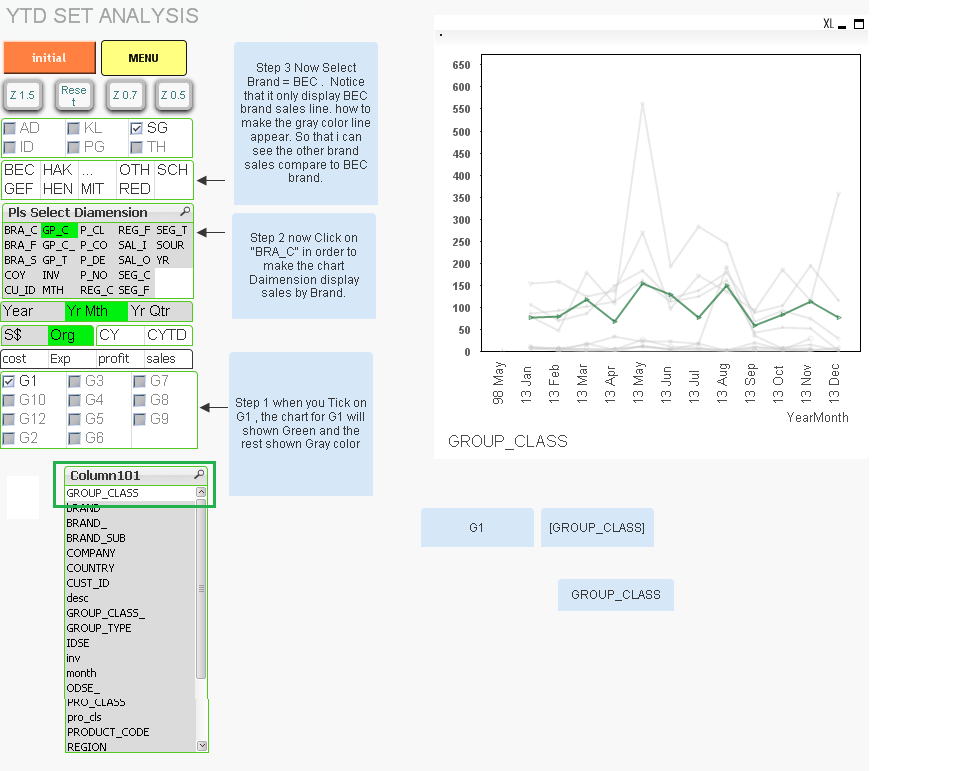
I have a chart which is work fine . when diamension i using field name GROUP_CLASS. it will display the selected Label Green color and the rest not select line will be gray color.
Now when i change the diamension i using field name BRAND , the selected Brand will display as Green , but issue is those not selected brand the line not appear as gray color,
Hope some one can advise me.
Paul
Accepted Solutions
- Mark as New
- Bookmark
- Subscribe
- Mute
- Subscribe to RSS Feed
- Permalink
- Report Inappropriate Content
Hi Paul,
I’ve taken a quick look at your app and your 3rd option is working perfectly but maybe I’m misunderstanding you what you are trying to achieve.
Your line chart has got two dimensions
- =$(ColumnDim_p)
- =$(ColumnDim101)
The expression I used is the same as your option 3:
sum({$<year = {">=$(=max(year),4)"}, month = {"<=$(=max({<year={$(=max(year))}>} month))"},$(ColumnDim101)= >}sales/1000)
When I select BRA_C is shows the Brands in the line chart. In my case I’ve selected BECKHOFF and this line is dark green. The same happens when I select GP_C. Take a look at the enclosed screen shots.
Is this what you want?
Regards,
Michiel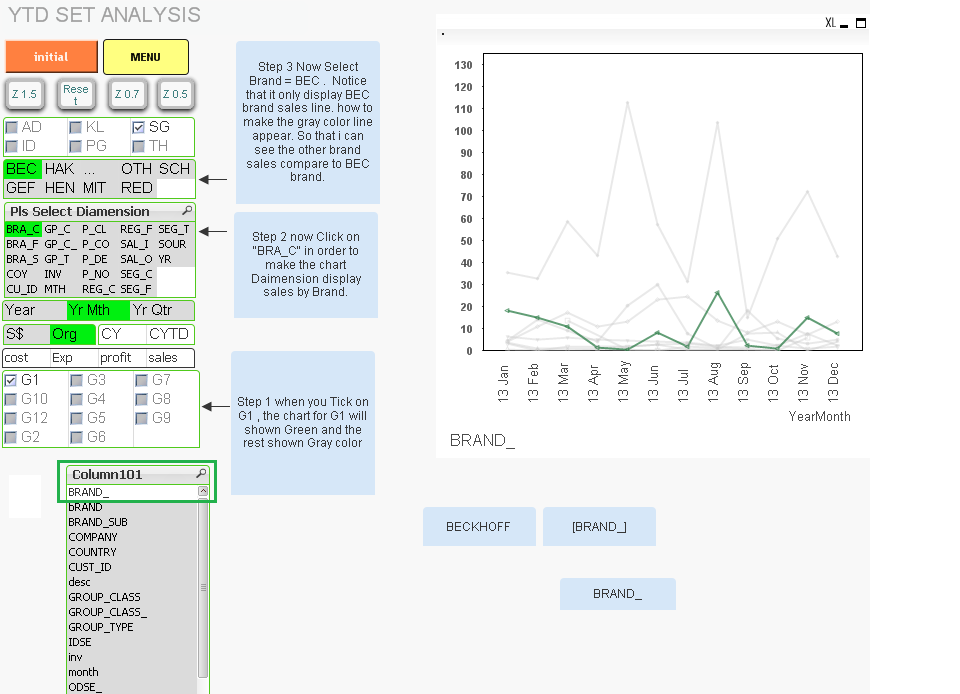
- Mark as New
- Bookmark
- Subscribe
- Mute
- Subscribe to RSS Feed
- Permalink
- Report Inappropriate Content
Enclosed is my QV Doc
- Mark as New
- Bookmark
- Subscribe
- Mute
- Subscribe to RSS Feed
- Permalink
- Report Inappropriate Content
Hi Paul,
Change your expression to:
({$<year = {">=$(=max(year),4)"}, month = {"<=$(=max({<year={$(=max(year))}>} month))"},BRAND_=>}sales/1000)
Regards,
Michiel
- Mark as New
- Bookmark
- Subscribe
- Mute
- Subscribe to RSS Feed
- Permalink
- Report Inappropriate Content
Hi Michael
Many thank for your help in make it work , But I discover that :-
1) below script work for BRAND_ work fine. ( suggest by you ).
sum({$<year = {">=$(=max(year),4)"}, month = {"<=$(=max({<year={$(=max(year))}>} month))"},BRAND_=>}sales/1000)
2) Below script work for GROUP_CLASS ( my orginal code work fine )
sum({$<year = {">=$(=max(year),4)"}, month = {"<=$(=max({<year={$(=max(year))}>} month))"},GROUP_CLASS=>}sales/1000)
3) if i use $(ColumnDim101) , it should work for both , but it is not working for both.
sum({$<year = {">=$(=max(year),4)"}, month = {"<=$(=max({<year={$(=max(year))}>} month))"},$(ColumnDim101)=>}sales/1000)
May i know you have any idea ? to make both work.
Paul
- Mark as New
- Bookmark
- Subscribe
- Mute
- Subscribe to RSS Feed
- Permalink
- Report Inappropriate Content
Hi Paul,
I’ve taken a quick look at your app and your 3rd option is working perfectly but maybe I’m misunderstanding you what you are trying to achieve.
Your line chart has got two dimensions
- =$(ColumnDim_p)
- =$(ColumnDim101)
The expression I used is the same as your option 3:
sum({$<year = {">=$(=max(year),4)"}, month = {"<=$(=max({<year={$(=max(year))}>} month))"},$(ColumnDim101)= >}sales/1000)
When I select BRA_C is shows the Brands in the line chart. In my case I’ve selected BECKHOFF and this line is dark green. The same happens when I select GP_C. Take a look at the enclosed screen shots.
Is this what you want?
Regards,
Michiel
- Mark as New
- Bookmark
- Subscribe
- Mute
- Subscribe to RSS Feed
- Permalink
- Report Inappropriate Content
Hi Sir
I think now I am encounter some issue on the software.
As now your side is working fine. And mine side is not working fine.
It can be cause by some of the field is activated.
I need to take time to solve.
Paul
Sent from Samsung Mobile