Unlock a world of possibilities! Login now and discover the exclusive benefits awaiting you.
- Qlik Community
- :
- All Forums
- :
- QlikView App Dev
- :
- Re: Re: Display data in a chart from dates sorted ...
- Subscribe to RSS Feed
- Mark Topic as New
- Mark Topic as Read
- Float this Topic for Current User
- Bookmark
- Subscribe
- Mute
- Printer Friendly Page
- Mark as New
- Bookmark
- Subscribe
- Mute
- Subscribe to RSS Feed
- Permalink
- Report Inappropriate Content
Display data in a chart from dates sorted by weekdays
Hi,
My chart is Time (x-axis) to Amount of Sales (y-axis). Time and Date are my key fields. All my data is loaded from an excel sheet as a crosstable.
I would like my chart to display the Amount of Sales from only Monday, or Tuesday, or Wednesday, etc.
I have tried a lot of things like the weekday() function, but nothing has worked for me.
Could you please help me? 
Best Regards,
Lucas
- « Previous Replies
- Next Replies »
Accepted Solutions
- Mark as New
- Bookmark
- Subscribe
- Mute
- Subscribe to RSS Feed
- Permalink
- Report Inappropriate Content
Turns out I found the answer!
I had to change the "date#(Dates,'DD.MM.YYYY')" to "date#(Dates,'DD.MM.YYYY') as DatesNew" and then replace the 'Dates' fields with 'DatesNew'!
Thanks for your answers anyway and have a great day,
Lucas
- Mark as New
- Bookmark
- Subscribe
- Mute
- Subscribe to RSS Feed
- Permalink
- Report Inappropriate Content
Can you post a sample app or your load script this will help put the answer in context.
You can calculate the day of the week using weekday(YourDateField>)
- Mark as New
- Bookmark
- Subscribe
- Mute
- Subscribe to RSS Feed
- Permalink
- Report Inappropriate Content
This is my load script:
SET ThousandSep="'";
SET DecimalSep='.';
SET MoneyThousandSep="'";
SET MoneyDecimalSep='.';
SET MoneyFormat='Fr. #''##0.00;Fr.-#''##0.00';
SET TimeFormat='hh:mm:ss';
SET DateFormat='DD.MM.YYYY';
SET TimestampFormat='DD.MM.YYYY hh:mm:ss[.fff]';
SET MonthNames='Jan;Feb;Mrz;Apr;Mai;Jun;Jul;Aug;Sep;Okt;Nov;Dez';
SET DayNames='Mo;Di;Mi;Do;Fr;Sa;So';
Directory;
CrossTable(Date, DataA)
LOAD F1,
[02.01.2013],
[03.01.2013],
[04.01.2013],
[07.01.2013],
[08.01.2013],
[09.01.2013],
[10.01.2013],
[11.01.2013],
[14.01.2013],
[15.01.2013],
[16.01.2013],
[17.01.2013],
[18.01.2013],
[21.01.2013],
[22.01.2013],
[23.01.2013],
[24.01.2013],
[25.01.2013],
[28.01.2013],
[29.01.2013],
[30.01.2013],
[31.01.2013]
FROM
(
Remove(Row, Pos(Top, 53)),
Remove(Row, Pos(Top, 52)),
Remove(Row, Pos(Top, 51)),
Remove(Row, Pos(Top, 7)),
Remove(Row, Pos(Top, 6)),
Remove(Row, Pos(Top, 5)),
Remove(Row, Pos(Top, 4)),
Remove(Row, Pos(Top, 3)),
Remove(Row, Pos(Top, 2)),
Remove(Row, Pos(Top, 1)),
Remove(Col, Pos(Top, 25)),
Remove(Col, Pos(Top, 1))
));
Directory;
CrossTable(Date, DataA)
LOAD F1,
[01.02.2013],
[04.02.2013],
[05.02.2013],
[06.02.2013],
[07.02.2013],
[08.02.2013],
[11.02.2013],
[12.02.2013],
[13.02.2013],
[14.02.2013],
[15.02.2013],
[18.02.2013],
[19.02.2013],
[20.02.2013],
[21.02.2013],
[22.02.2013],
[25.02.2013],
[26.02.2013],
[27.02.2013],
[28.02.2013]
FROM
(
Remove(Row, Pos(Top, 7)),
Remove(Row, Pos(Top, 6)),
Remove(Row, Pos(Top, 5)),
Remove(Row, Pos(Top, 4)),
Remove(Row, Pos(Top, 3)),
Remove(Row, Pos(Top, 2)),
Remove(Row, Pos(Top, 1)),
Remove(Col, Pos(Top, 1)),
Remove(Row, Pos(Top, 45)),
Remove(Row, Pos(Top, 44)),
Remove(Col, Pos(Top, 22))
));
etc.
The excel file looks something like this:
F1 02.01.2014 03.01.2014 04.01.2014 etc.
07:00:00 5 7 6
07:30:00 10 6 5
etc.
When I use the crosstable its like this:
F1 Date DataA
07:00:00 02.01.2014 5
07:30:00 02.01.2014 7
07:00:00 03.01.2014 6
07:30:00 03.01.2014 6
etc.
Using weekday(Date) as a calculated dimension hasn't worked for me.
My normal chart is set up with
Used Dimensions: F1
Expressions: Sum(DataA)
Thanks for your reply,
Best Regards,
Lucas
- Mark as New
- Bookmark
- Subscribe
- Mute
- Subscribe to RSS Feed
- Permalink
- Report Inappropriate Content
The reason that weekday(DateA) does not work is that you need to convert your data to a recognised date field in QlikView.
Try adding this after the load script, where <YourTableName> is the table name created in your current load script. This will create a correct date field
Table2:
load
weekday(date) as weekday,
* ;
load
F1 as time,
date(date#(Date, 'DD.MM.YYYY'))) as date,
DataA
resident <YourTableName> ;
drop table <YourTableName> ;
- Mark as New
- Bookmark
- Subscribe
- Mute
- Subscribe to RSS Feed
- Permalink
- Report Inappropriate Content
Thanks for the reply,
When I add your solution after the load script and name all my tables 'Main', it doesn't give me an error, but the chart doesn't work anymore (only naming one table 'Main' didn't work). It shows "No data to display" because of the drop table function, and if I remove it from the script, the chart shows the exact same as before. Is there any other way to format a Crosstable Field as a date?
Best Regards,
Lucas
EDIT: I think I can get the Crosstable Field to be recognized as a date, but now I need help with my chart. My dimensions are F1 and weekday(Date) = 'Mo'. My expression is Sum(DataA). It seems like the chart ignores the weekday(Date) = 'Mo' dimension.
- Mark as New
- Bookmark
- Subscribe
- Mute
- Subscribe to RSS Feed
- Permalink
- Report Inappropriate Content
hi Lucas
Please find Attachment
you will get weekly analysis
- Mark as New
- Bookmark
- Subscribe
- Mute
- Subscribe to RSS Feed
- Permalink
- Report Inappropriate Content
Thanks for the reply,
I have a Qlikview Personal Edition, so I can't view your document. Could you post a few screenshots or fotos instead?
Many thanks,
Lucas
- Mark as New
- Bookmark
- Subscribe
- Mute
- Subscribe to RSS Feed
- Permalink
- Report Inappropriate Content
in dimension use this
if(Num(WeekDay(Date_field))=0 ,'Mon',
if(Num(WeekDay(Date_field))=1 ,'Tue',
if(Num(WeekDay(Date_field))=2 ,'Wen',
if(Num(WeekDay(Date_field))=3 ,'Thr',
if(Num(WeekDay(Date_field))=4 ,'Fri',
if(Num(WeekDay(Date_field))=5 ,'Sat',
if(Num(WeekDay(Date_field))=6 ,'Sun')))))))
please have look at image
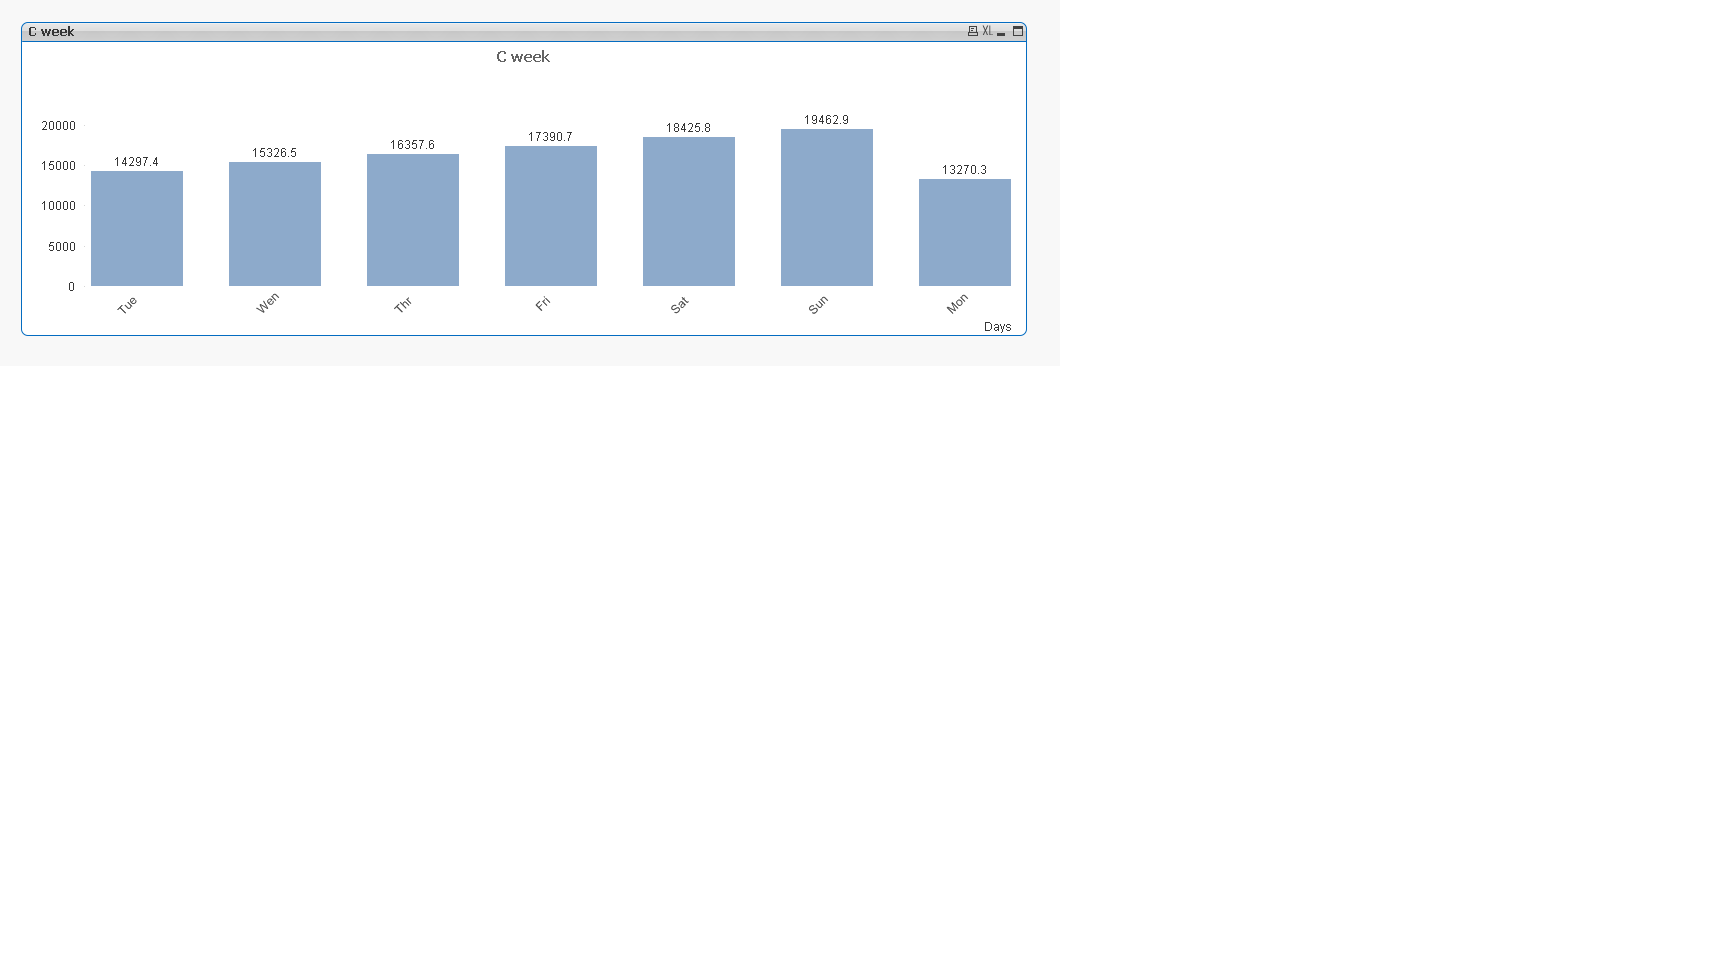
- Mark as New
- Bookmark
- Subscribe
- Mute
- Subscribe to RSS Feed
- Permalink
- Report Inappropriate Content
Thanks for the reply!
It makes a lot of sense, and my chart should definitely work now, but it doesn't.
Here is my load script, maybe there's something wrong there:
SET ThousandSep="'";
SET DecimalSep='.';
SET MoneyThousandSep="'";
SET MoneyDecimalSep='.';
SET MoneyFormat='Fr. #''##0.00;Fr.-#''##0.00';
SET TimeFormat='hh:mm:ss';
SET DateFormat='DD.MM.YYYY';
SET TimestampFormat='DD.MM.YYYY hh:mm:ss[.fff]';
SET MonthNames='Jan;Feb;Mrz;Apr;Mai;Jun;Jul;Aug;Sep;Okt;Nov;Dez';
SET DayNames='Mo;Di;Mi;Do;Fr;Sa;So';
Directory;
Temp:
CrossTable(Date, Data)
LOAD F1,
[02.01.2014],
[03.01.2014],
[06.01.2014],
[07.01.2014],
[08.01.2014],
[09.01.2014],
[10.01.2014],
[13.01.2014],
[14.01.2014],
[15.01.2014],
[16.01.2014],
[17.01.2014],
[20.01.2014],
[21.01.2014],
[22.01.2014],
[23.01.2014],
[24.01.2014],
[27.01.2014],
[28.01.2014],
[29.01.2014],
[30.01.2014],
[31.01.2014]
FROM
[x.xls]
(biff, embedded labels, table is Anrufe$, filters(
Remove(Row, Pos(Top, 7)),
Remove(Row, Pos(Top, 6)),
Remove(Row, Pos(Top, 5)),
Remove(Row, Pos(Top, 4)),
Remove(Row, Pos(Top, 3)),
Remove(Row, Pos(Top, 2)),
Remove(Row, Pos(Top, 1)),
Remove(Col, Pos(Top, 1)),
Remove(Col, Pos(Top, 24)),
Remove(Row, Pos(Top, 45)),
Remove(Row, Pos(Top, 44))
));
Temp2:
LOAD *,
Date(Date,'DD.MM.YYYY') as "Real Date"
Resident Temp;
DROP TABLE Temp;
My chart is below (it just shows the Sum of all data), and my expression is: Sum(Data)
- Mark as New
- Bookmark
- Subscribe
- Mute
- Subscribe to RSS Feed
- Permalink
- Report Inappropriate Content
can u attach qvw file i will do it
- « Previous Replies
- Next Replies »