Unlock a world of possibilities! Login now and discover the exclusive benefits awaiting you.
- Qlik Community
- :
- All Forums
- :
- QlikView App Dev
- :
- Re: Re: Display data in a chart from dates sorted ...
- Subscribe to RSS Feed
- Mark Topic as New
- Mark Topic as Read
- Float this Topic for Current User
- Bookmark
- Subscribe
- Mute
- Printer Friendly Page
- Mark as New
- Bookmark
- Subscribe
- Mute
- Subscribe to RSS Feed
- Permalink
- Report Inappropriate Content
Display data in a chart from dates sorted by weekdays
Hi,
My chart is Time (x-axis) to Amount of Sales (y-axis). Time and Date are my key fields. All my data is loaded from an excel sheet as a crosstable.
I would like my chart to display the Amount of Sales from only Monday, or Tuesday, or Wednesday, etc.
I have tried a lot of things like the weekday() function, but nothing has worked for me.
Could you please help me? 
Best Regards,
Lucas
- « Previous Replies
- Next Replies »
- Mark as New
- Bookmark
- Subscribe
- Mute
- Subscribe to RSS Feed
- Permalink
- Report Inappropriate Content
then in expression write this
Sum({<Dates={'>=$(vRollingWeek)<=$(vSelectedDate)'}>}Count)
- Mark as New
- Bookmark
- Subscribe
- Mute
- Subscribe to RSS Feed
- Permalink
- Report Inappropriate Content
Hi,
I don't think that's going to work, because you have variables in the dimension which I don't where they come from and "Temp1: LOAD Date(Date#(Dates,'DD.MM.YYYY')) as Dates" always gives me an error. And I already found a solution, but thank you for your time!
- Mark as New
- Bookmark
- Subscribe
- Mute
- Subscribe to RSS Feed
- Permalink
- Report Inappropriate Content
u can check your data now
- Mark as New
- Bookmark
- Subscribe
- Mute
- Subscribe to RSS Feed
- Permalink
- Report Inappropriate Content
first u Use script then in front end u have to use two vairbles
- Mark as New
- Bookmark
- Subscribe
- Mute
- Subscribe to RSS Feed
- Permalink
- Report Inappropriate Content
What are the definitions of the variables?
- Mark as New
- Bookmark
- Subscribe
- Mute
- Subscribe to RSS Feed
- Permalink
- Report Inappropriate Content
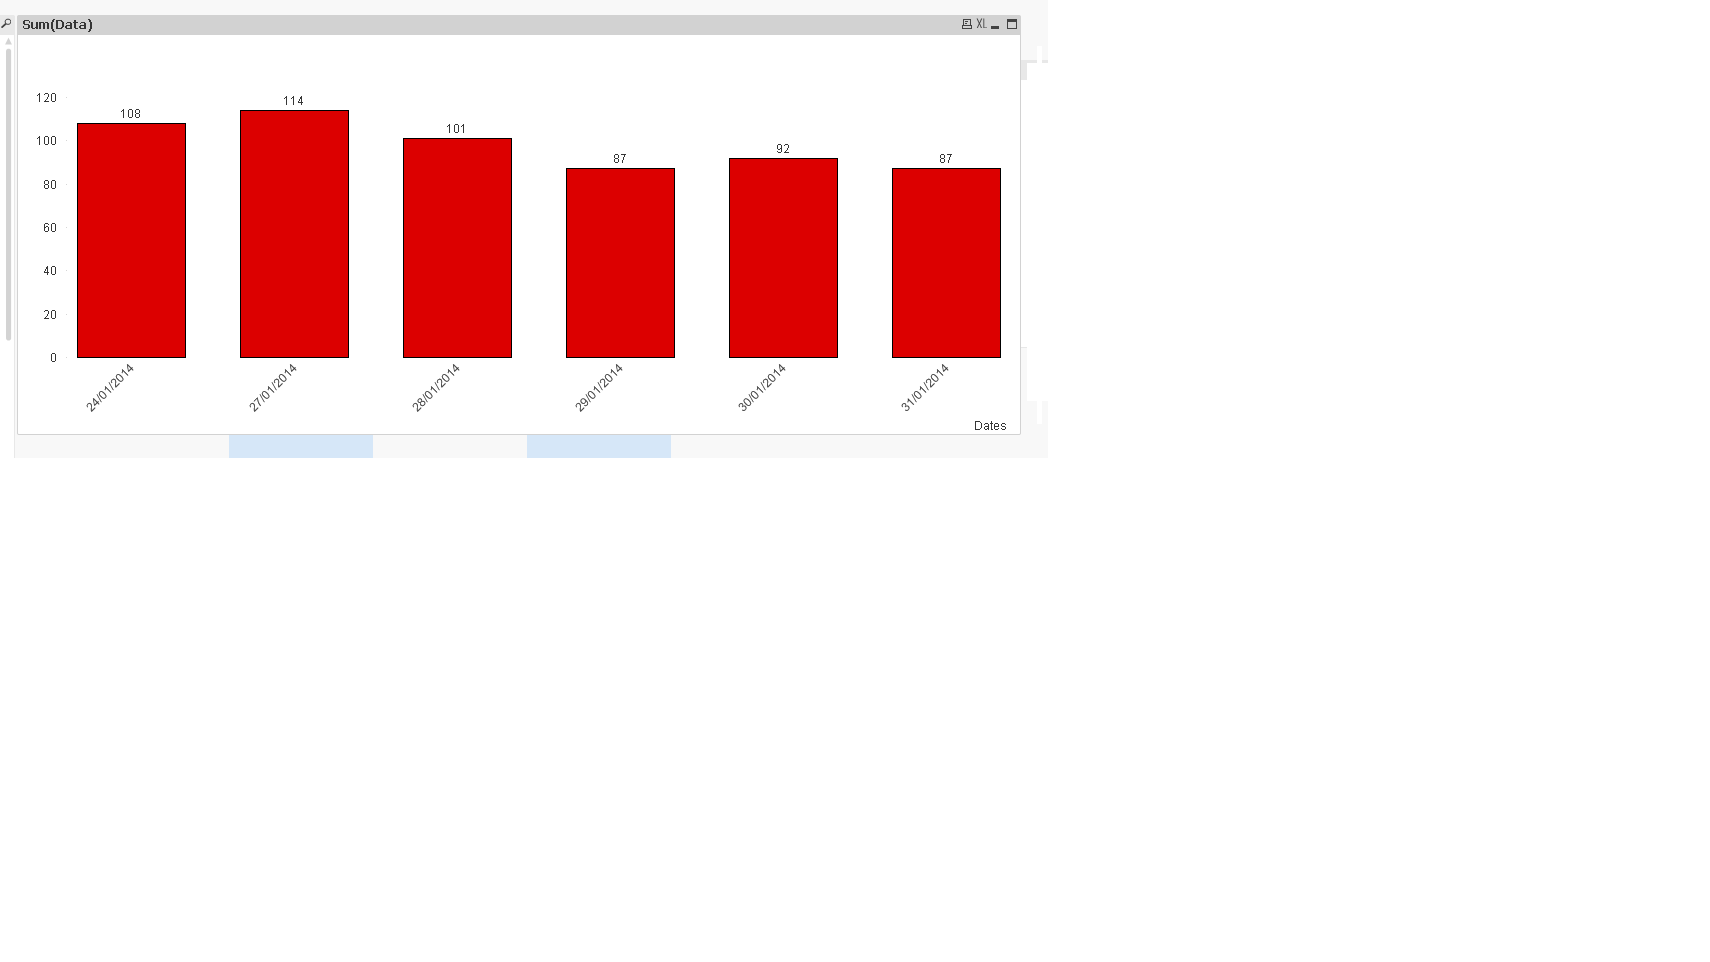
I want this a as a result: 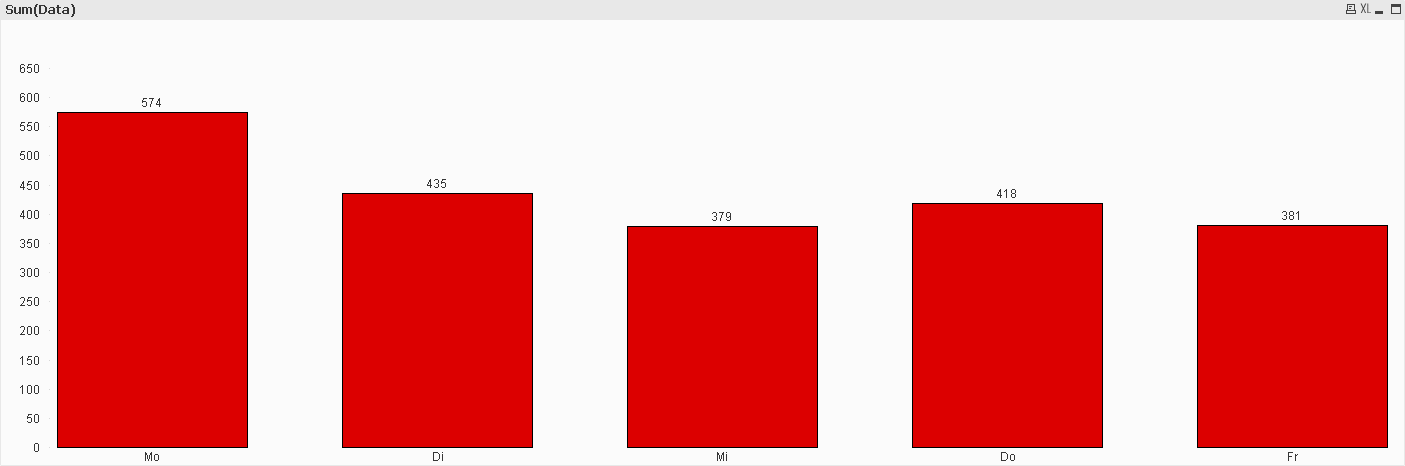
- Mark as New
- Bookmark
- Subscribe
- Mute
- Subscribe to RSS Feed
- Permalink
- Report Inappropriate Content
vSelectedDate=Max(Dates)
vRollingWeek=vSelectedDate-6
- « Previous Replies
- Next Replies »