Unlock a world of possibilities! Login now and discover the exclusive benefits awaiting you.
- Qlik Community
- :
- All Forums
- :
- QlikView App Dev
- :
- Re: exclude a few data points from one of the few ...
- Subscribe to RSS Feed
- Mark Topic as New
- Mark Topic as Read
- Float this Topic for Current User
- Bookmark
- Subscribe
- Mute
- Printer Friendly Page
- Mark as New
- Bookmark
- Subscribe
- Mute
- Subscribe to RSS Feed
- Permalink
- Report Inappropriate Content
exclude a few data points from one of the few lines in a line chart
Hi there, firstly thanks for your time! This question has being holding off my work for days...
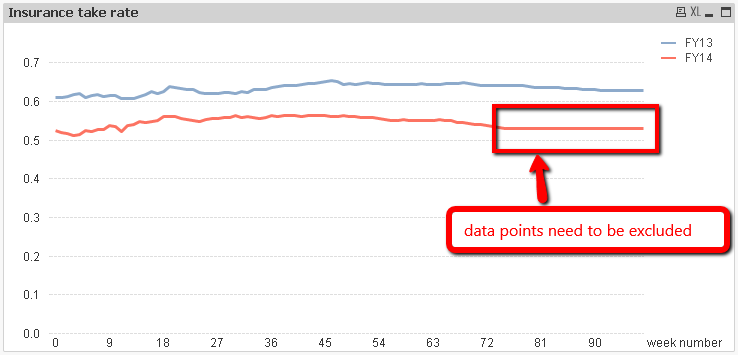
I have a line chart, x-axis is week number, y-axis is insurance take-rate(one line for [fiscal] = 2014, the other for [fiscal] = 2013).
Since the latest [week number] for FY14 is 75, the value of insurance take-rate is not valid for any week with a [week number] larger than 75, and you can see it's all flat when the [week number] is >= 75.
What I need to solve is to exclude those data points where the [week number] is >= 75 AND ONLY FOR [fiscal] = 2014; I don't want to do any change on [fiscal] = 2013 since for 2013, all value is valid.
The data points need to be excluded is shown in the following chart, and I attached the excel & qvw file here.
Please let me know if you have any hints or solutions!
Thanks!
Xuan
Accepted Solutions
- Mark as New
- Bookmark
- Subscribe
- Mute
- Subscribe to RSS Feed
- Permalink
- Report Inappropriate Content
Maybe:
if([week number] <=75,rangesum(above(total sum({$<fiscal = {'2014'}>}insurance_take), 0, RowNo()))
/rangesum(above(total count({$<fiscal = {'2014'}>}ID), 0, RowNo())))
- Mark as New
- Bookmark
- Subscribe
- Mute
- Subscribe to RSS Feed
- Permalink
- Report Inappropriate Content
I think you may have forgotten to attach your files  . But as a guess, an if statement should do the job.
- Mark as New
- Bookmark
- Subscribe
- Mute
- Subscribe to RSS Feed
- Permalink
- Report Inappropriate Content
Something like below
SUM({<Year = {'2013'}>}TakeRate)
&
SUM({<Year = {'2014'}, Week = {'<=75'} >}TakeRate)
Change SUM with your respective Aggr Function
and Year and Week should be as per your field name.
- Mark as New
- Bookmark
- Subscribe
- Mute
- Subscribe to RSS Feed
- Permalink
- Report Inappropriate Content
Hi, the expressions I used were:
it's in rangesum function
FY13:
rangesum(above(total sum({$<fiscal = {'2013'}>}insurance_take), 0, RowNo()))
/rangesum(above(total count({$<fiscal = {'2013'}>}ID), 0, RowNo()))
FY14:
rangesum(above(total sum({$<fiscal = {'2014'}>}insurance_take), 0, RowNo()))
/rangesum(above(total count({$<fiscal = {'2014'}>}ID), 0, RowNo()))
- Mark as New
- Bookmark
- Subscribe
- Mute
- Subscribe to RSS Feed
- Permalink
- Report Inappropriate Content
Hi Jerem, sorry I made a mistake, because it was recovered so the file was not there any more. but
the expressions I used were:
it's in rangesum function
FY13:
rangesum(above(total sum({$<fiscal = {'2013'}>}insurance_take), 0, RowNo()))
/rangesum(above(total count({$<fiscal = {'2013'}>}ID), 0, RowNo()))
FY14:
rangesum(above(total sum({$<fiscal = {'2014'}>}insurance_take), 0, RowNo()))
/rangesum(above(total count({$<fiscal = {'2014'}>}ID), 0, RowNo()))
- Mark as New
- Bookmark
- Subscribe
- Mute
- Subscribe to RSS Feed
- Permalink
- Report Inappropriate Content
add week as per my above reply and let me know what you got
rangesum(above(total sum({$<fiscal = {'2014'}, Week = {'<=75'}>}insurance_take), 0, RowNo()))
- Mark as New
- Bookmark
- Subscribe
- Mute
- Subscribe to RSS Feed
- Permalink
- Report Inappropriate Content
Click on the + in front of the expression, select Background Color and add an expression to calculate the color. Something like =if( [week number] is >= 75 AND [fiscal] = 2014, white(0))
talk is cheap, supply exceeds demand
- Mark as New
- Bookmark
- Subscribe
- Mute
- Subscribe to RSS Feed
- Permalink
- Report Inappropriate Content
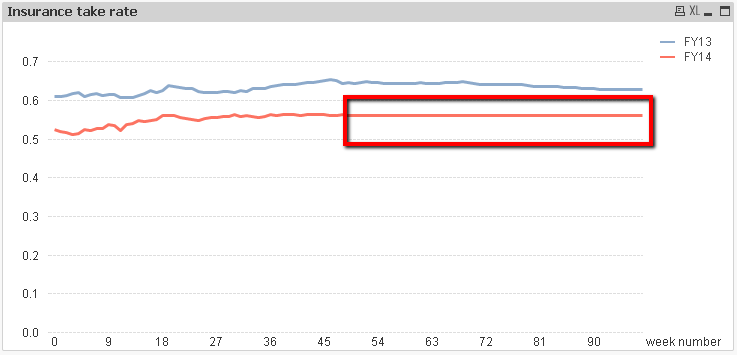
hi, it didn't exclude the data points, but only stopped doing the cumulative calculating for weeks >= X.
I did this:
rangesum(above(total sum({$<fiscal = {'2014'}, [week number] = {'<= 50'}>}insurance_take), 0, RowNo()))
/rangesum(above(total count({$<fiscal = {'2014'}, [week number] = {'<= 50'}>}ID), 0, RowNo()))
and got the chart:
- Mark as New
- Bookmark
- Subscribe
- Mute
- Subscribe to RSS Feed
- Permalink
- Report Inappropriate Content
Maybe:
if([week number] <=75,rangesum(above(total sum({$<fiscal = {'2014'}>}insurance_take), 0, RowNo()))
/rangesum(above(total count({$<fiscal = {'2014'}>}ID), 0, RowNo())))
- Mark as New
- Bookmark
- Subscribe
- Mute
- Subscribe to RSS Feed
- Permalink
- Report Inappropriate Content
Great, it worked!
Thanks thanks thanks Jerem1234!