Unlock a world of possibilities! Login now and discover the exclusive benefits awaiting you.
- Qlik Community
- :
- All Forums
- :
- QlikView App Dev
- :
- Re: dinamic dashboard
- Subscribe to RSS Feed
- Mark Topic as New
- Mark Topic as Read
- Float this Topic for Current User
- Bookmark
- Subscribe
- Mute
- Printer Friendly Page
- Mark as New
- Bookmark
- Subscribe
- Mute
- Subscribe to RSS Feed
- Permalink
- Report Inappropriate Content
dinamic dashboard
Hello to all
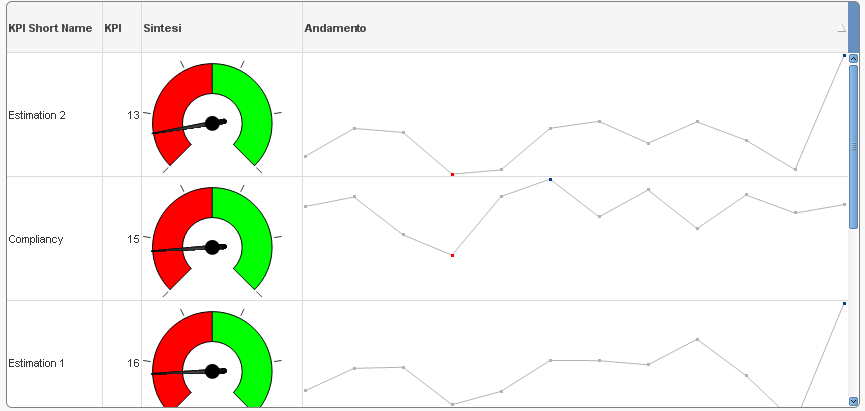
in a graph of type table, I set the table cell type dashboard.
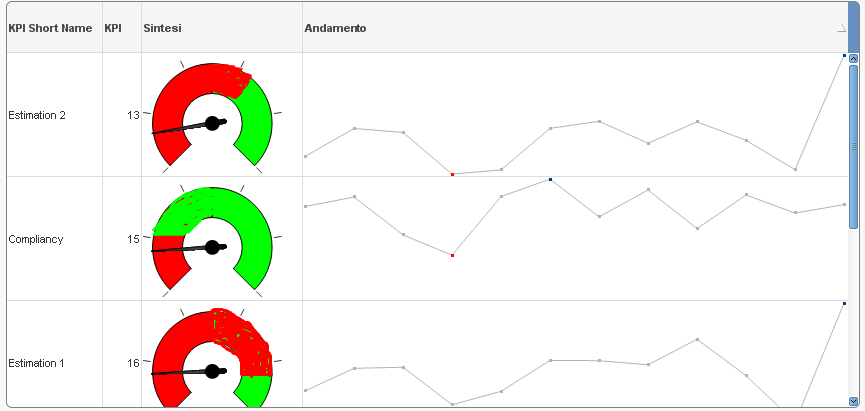
the colored bands of the dashboard, however, are fixed for all values of the table while I need to have them dynamic, based on a threshold value.
sapreppe someone show me how to do?
if I create a dashboard object I can set the width of the bands in a dynamic way, the problem is when the dashboard represent it within a cell of a chart table.
Thanks for your cooperation
Andrea
result
i want
- « Previous Replies
-
- 1
- 2
- Next Replies »
- Mark as New
- Bookmark
- Subscribe
- Mute
- Subscribe to RSS Feed
- Permalink
- Report Inappropriate Content
colud you post your doc (.qvw) or an image of the problem?
- Mark as New
- Bookmark
- Subscribe
- Mute
- Subscribe to RSS Feed
- Permalink
- Report Inappropriate Content
i post images thanks
- Mark as New
- Bookmark
- Subscribe
- Mute
- Subscribe to RSS Feed
- Permalink
- Report Inappropriate Content
Hope I'm wrong but don't think is possible
- Mark as New
- Bookmark
- Subscribe
- Mute
- Subscribe to RSS Feed
- Permalink
- Report Inappropriate Content
if I create an object of type from the options of the dashboard chart, I can set the segments dynamically through a variable (or field)
dashboards within a table, the size of the segments can be changed but with a fixed number which is valid for all dashboards.
- Mark as New
- Bookmark
- Subscribe
- Mute
- Subscribe to RSS Feed
- Permalink
- Report Inappropriate Content
se crei un grafico di tipo cruscotto cambi colori ecc dei segmenti;
se crei un grafico di tipo tabella e poi per un'espressione (colonna Sintesi) scegli di rappresentarla come cruscotto (come il tuo caso) le impostazioni (minimo, massimo, colori segmenti), x quel che mi risulta, sono le stesse x tutte le righe dell'espressione Sintesi
- Mark as New
- Bookmark
- Subscribe
- Mute
- Subscribe to RSS Feed
- Permalink
- Report Inappropriate Content
You'll need to look into the Aggr() function.
- Mark as New
- Bookmark
- Subscribe
- Mute
- Subscribe to RSS Feed
- Permalink
- Report Inappropriate Content
do you mean you can have different min/max for different rows in the same column ?
or different segment lower bound for different rows in the same column ?
- Mark as New
- Bookmark
- Subscribe
- Mute
- Subscribe to RSS Feed
- Permalink
- Report Inappropriate Content
I tried using the function AGR formula.puoi mistake but maybe give me an example?
- Mark as New
- Bookmark
- Subscribe
- Mute
- Subscribe to RSS Feed
- Permalink
- Report Inappropriate Content
tramite set analisys non posso variare le impostazioni (ad esempio colori segmenti) sulla singola riga in base al contenuto di un campo per quella riga , presente nella tabella?
- « Previous Replies
-
- 1
- 2
- Next Replies »