Unlock a world of possibilities! Login now and discover the exclusive benefits awaiting you.
- Qlik Community
- :
- All Forums
- :
- QlikView App Dev
- :
- Re: Pivot Challenge (Show all values)
- Subscribe to RSS Feed
- Mark Topic as New
- Mark Topic as Read
- Float this Topic for Current User
- Bookmark
- Subscribe
- Mute
- Printer Friendly Page
- Mark as New
- Bookmark
- Subscribe
- Mute
- Subscribe to RSS Feed
- Permalink
- Report Inappropriate Content
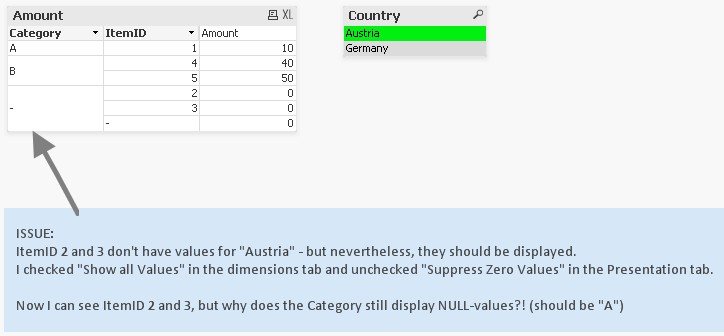
Pivot Challenge (Show all values)
Could someone help me out on this?
Regards,
Florian
Accepted Solutions
- Mark as New
- Bookmark
- Subscribe
- Mute
- Subscribe to RSS Feed
- Permalink
- Report Inappropriate Content
If you want show data which doesn't exist - for a null-analysis - it will be necessary to create these data. Completely meant this to create a cartesian product - most often the amount of data is then too big and it needed to be reduced on the most important data-area and/or with splitting in slices.
To do this within the script is the easiest way but in cases from reduced/splitted date not very flexible. Within the GUI you could achieve such data-structure with dynamic dimensions - it is more flexible from the included data-areas but worse from handling and performance.
Perhaps these or similar links are helpful for you:
Re: 0 Wert in Diagramm anzeigen wenn keine Daten vorhanden
Re: Nicht-Verkäufe transparent darstellen
Re: immer alle Lagerorte anzeigen
- Marcus
- Mark as New
- Bookmark
- Subscribe
- Mute
- Subscribe to RSS Feed
- Permalink
- Report Inappropriate Content
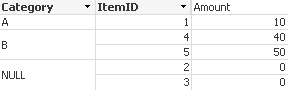
I'm not sure if I understand your issue right, if not you would have probably to extend your data-model to combine all possible combination of Categorie and ItemID inclusive null-values.
- Marcus
- Mark as New
- Bookmark
- Subscribe
- Mute
- Subscribe to RSS Feed
- Permalink
- Report Inappropriate Content
Thanks for your reply, Marcus. I understand your suggestion of adding 0-values for all possible combinations of Category and ItemID.
Of course that's no problem for the little example that I posted. But in my real application I have got about 10 fields with a lot of distinct values -> the number of possible combinations is exploding (> 10,000,000 records)
Is there a way to avoid that "script workaround"?
Regards,
Florian
- Mark as New
- Bookmark
- Subscribe
- Mute
- Subscribe to RSS Feed
- Permalink
- Report Inappropriate Content
If you want show data which doesn't exist - for a null-analysis - it will be necessary to create these data. Completely meant this to create a cartesian product - most often the amount of data is then too big and it needed to be reduced on the most important data-area and/or with splitting in slices.
To do this within the script is the easiest way but in cases from reduced/splitted date not very flexible. Within the GUI you could achieve such data-structure with dynamic dimensions - it is more flexible from the included data-areas but worse from handling and performance.
Perhaps these or similar links are helpful for you:
Re: 0 Wert in Diagramm anzeigen wenn keine Daten vorhanden
Re: Nicht-Verkäufe transparent darstellen
Re: immer alle Lagerorte anzeigen
- Marcus
- Mark as New
- Bookmark
- Subscribe
- Mute
- Subscribe to RSS Feed
- Permalink
- Report Inappropriate Content
Your "dynamic dimensions" hint could be helpful ... I will give that a try. Thanks for your support!
Florian