Unlock a world of possibilities! Login now and discover the exclusive benefits awaiting you.
- Qlik Community
- :
- All Forums
- :
- QlikView App Dev
- :
- Re: How to show or visualize this kind of data?
- Subscribe to RSS Feed
- Mark Topic as New
- Mark Topic as Read
- Float this Topic for Current User
- Bookmark
- Subscribe
- Mute
- Printer Friendly Page
- Mark as New
- Bookmark
- Subscribe
- Mute
- Subscribe to RSS Feed
- Permalink
- Report Inappropriate Content
How to show or visualize this kind of data?
Hi community,
I would like to show or visualize the count of infection organisms by departments.There are many departments (over 20) and much more organisms (more than 50). The bubble chart is not a solution, since it requires two numeric expressions. I also tried to use grid chart, but it does not work either. What I want to do is to let users easily find the most organism in different department. I am not sure whether I state my question clear. Thanks
Accepted Solutions
- Mark as New
- Bookmark
- Subscribe
- Mute
- Subscribe to RSS Feed
- Permalink
- Report Inappropriate Content
Hello Haijun,
I found heatcharts to be very effective in these cases.
To do so, I would create a pivot table with dimensions department and organism name an add the # of organisms as an expression. Then by draging the department dimension to the top of the chart you can create one column per department each. The # of organisms then would be used to color code the background color (expression tab of the charts properties).
The result should look like this:
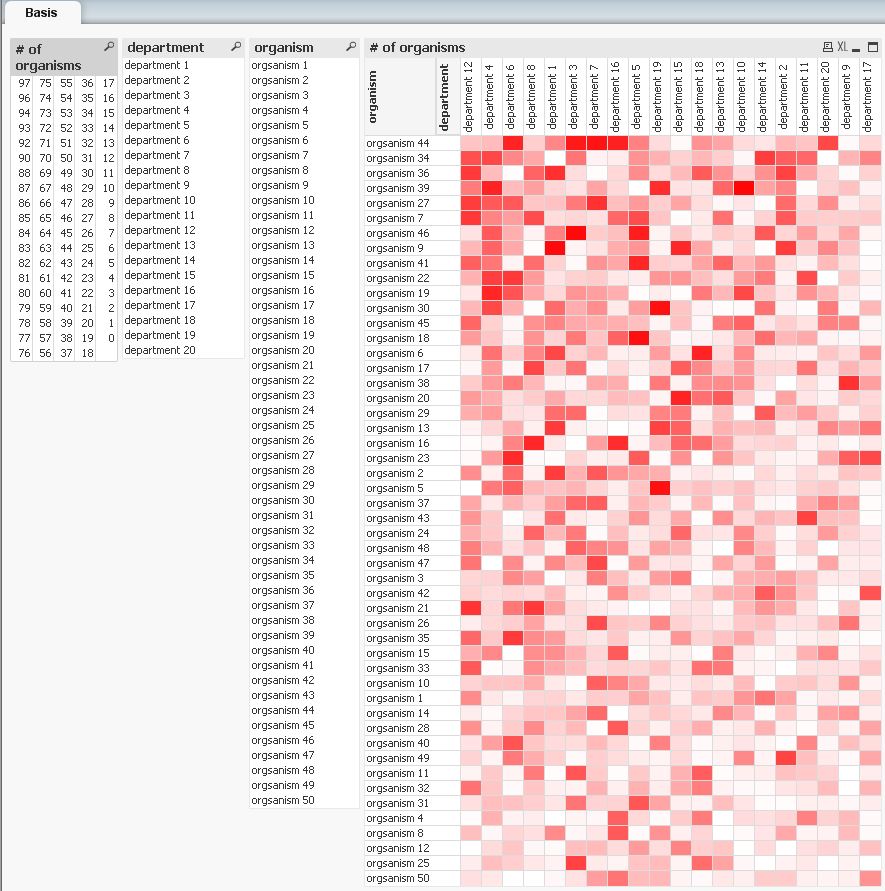
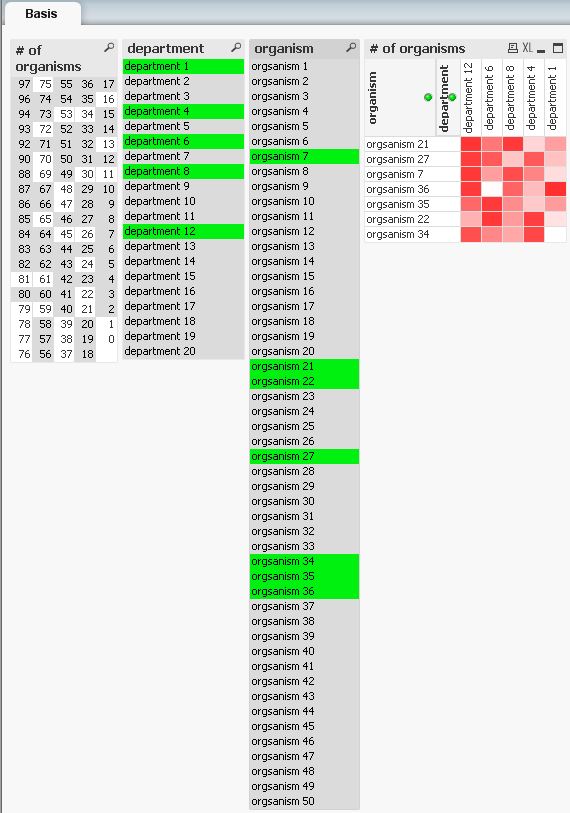
By sorting the organism and department dimensions using the # of organisms expression (descending) you can bring the most infectious of your organisms to the top of the table and the most involved departments to the left side.
This also allows for your users to focus on these specific departments and organisms:
Hope this helps
regards
Marco
- Mark as New
- Bookmark
- Subscribe
- Mute
- Subscribe to RSS Feed
- Permalink
- Report Inappropriate Content
Hello Haijun,
I found heatcharts to be very effective in these cases.
To do so, I would create a pivot table with dimensions department and organism name an add the # of organisms as an expression. Then by draging the department dimension to the top of the chart you can create one column per department each. The # of organisms then would be used to color code the background color (expression tab of the charts properties).
The result should look like this:
By sorting the organism and department dimensions using the # of organisms expression (descending) you can bring the most infectious of your organisms to the top of the table and the most involved departments to the left side.
This also allows for your users to focus on these specific departments and organisms:
Hope this helps
regards
Marco
- Mark as New
- Bookmark
- Subscribe
- Mute
- Subscribe to RSS Feed
- Permalink
- Report Inappropriate Content
I forgot the qvw 
Here it is ...
Marco
- Mark as New
- Bookmark
- Subscribe
- Mute
- Subscribe to RSS Feed
- Permalink
- Report Inappropriate Content
Wow Marco, i was seeing posts to answer, but your idea is very very good!!!
If you let me, i will use it!!