Unlock a world of possibilities! Login now and discover the exclusive benefits awaiting you.
- Qlik Community
- :
- All Forums
- :
- QlikView App Dev
- :
- Re: How to you stop a horizontal chart from export...
- Subscribe to RSS Feed
- Mark Topic as New
- Mark Topic as Read
- Float this Topic for Current User
- Bookmark
- Subscribe
- Mute
- Printer Friendly Page
- Mark as New
- Bookmark
- Subscribe
- Mute
- Subscribe to RSS Feed
- Permalink
- Report Inappropriate Content
How to you stop a horizontal chart from exporting to Excel horizontally?
Hi
I have created a table chart to approximate a Profit & Loss Statement.
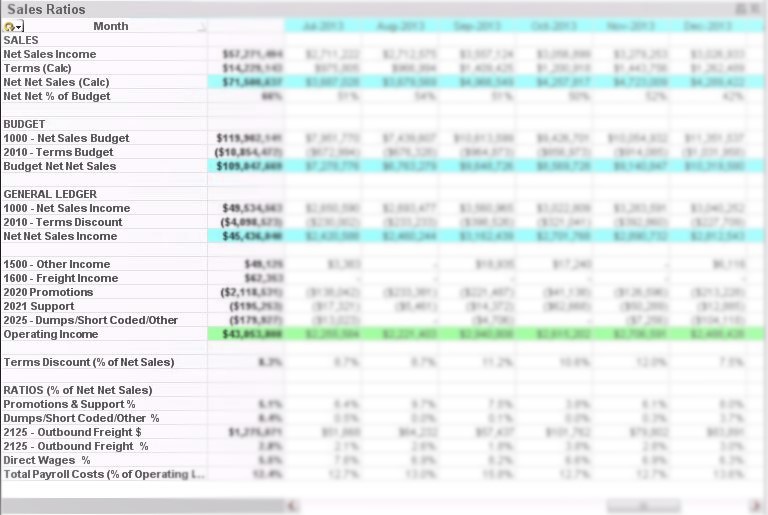
The dimension is financial periods, and to represent this dimension as columns with the expressions running in rows down the page, 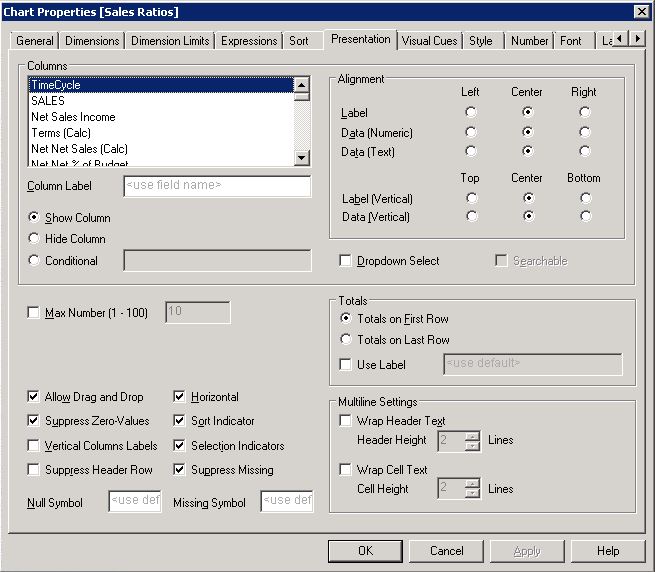
I had to tick the Horizontal box on the Presentation tab in Properties.
Unfortunately, when the chart exports to excel, the periods return to rows, and the expressions become columns.
Any idea on how to force QV to export it as per the chart object displays?
Cheers
- Mark as New
- Bookmark
- Subscribe
- Mute
- Subscribe to RSS Feed
- Permalink
- Report Inappropriate Content
Hi.
Use a Pivot Table. Drag and drop one expression label to the left (until the blue flag is vertical), then drag and drop the Month Dimmention to the right (until the flag is horizontal)
- Mark as New
- Bookmark
- Subscribe
- Mute
- Subscribe to RSS Feed
- Permalink
- Report Inappropriate Content
Thanks for that...it works, but I lose most of my formatting, and the the columns must now all be the same width - which is a problem because the chart expression names are quite long, but the data points are short i.e. I end up only showing 3-5 data columns.
Any other ideas?
- Mark as New
- Bookmark
- Subscribe
- Mute
- Subscribe to RSS Feed
- Permalink
- Report Inappropriate Content
If you want to force QV to export it as per the chart object displays than
you can simply right click on the chart > Click on Copy to Clipboard > Full Table > Open Excel sheet and paste the copied Table. After doing this you can do table formatting from excel.
Else, Use a Macro to Export Excel.
Regards
Aviral Nag
- Mark as New
- Bookmark
- Subscribe
- Mute
- Subscribe to RSS Feed
- Permalink
- Report Inappropriate Content
It's not a good new...
The only way to do that is making a table (from excel, or from inline) that has one column with the titles, and other with the expressions. Like:
concept_fld expression_fld order_fld
Sales income sum (sales) 1
Budget sum (Budget) 2
....
So, in your script, next to the reading of this table, you should set the variable:
expressions: Load concept_fld, expression_fld, order_fld From expressions.xls;
aux: Load
'Peek(order_fld,'&Concat(expression_fld, ',', order_fld) &')' as aux_exp
Resident expressions;
LetvExpression = Peek('aux_exp');
Drop table aux;
Now, your table will get two dimmentions: Period_field and expression_fld. Order the second by order_fld, and your expression will be =$(vExpression)
Like this way, you can use the excel file to standarize the expressions for the application.