Unlock a world of possibilities! Login now and discover the exclusive benefits awaiting you.
- Qlik Community
- :
- All Forums
- :
- QlikView App Dev
- :
- Display Multiple Datedimensions in on Diagramm
- Subscribe to RSS Feed
- Mark Topic as New
- Mark Topic as Read
- Float this Topic for Current User
- Bookmark
- Subscribe
- Mute
- Printer Friendly Page
- Mark as New
- Bookmark
- Subscribe
- Mute
- Subscribe to RSS Feed
- Permalink
- Report Inappropriate Content
Display Multiple Datedimensions in on Diagramm
Hi everyone,
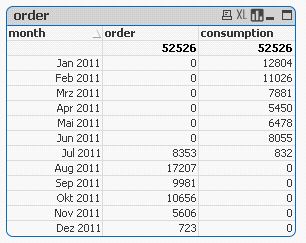
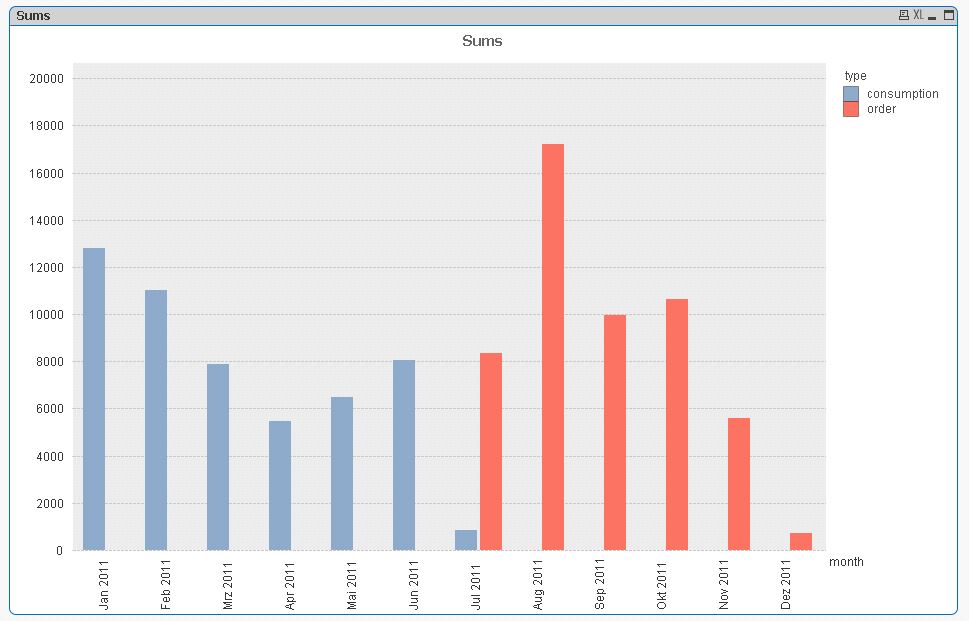
I've got a dataset where each row has 2 date dimensions (order date and consumption date). I'd like to display the sum on monthly basis for both dimensions in 1 diagram:
| month | orders | consumptions |
|---|---|---|
| Jan 2010 | 34 | 54 |
| Feb 2010 | 45 | 30 |
| Mar 2010 | 34 | 54 |
The original dataset is way too big to calculate it via an external calendar table and if-statements in the calculations. Does anyone deal with a similar problem and has got a solution for implementing such a date dimension with scripting?
Thanks!
Best regards,
Benedikt
Accepted Solutions
- Mark as New
- Bookmark
- Subscribe
- Mute
- Subscribe to RSS Feed
- Permalink
- Report Inappropriate Content
Hallo Benedikt,
maybe this is what you are looking for:
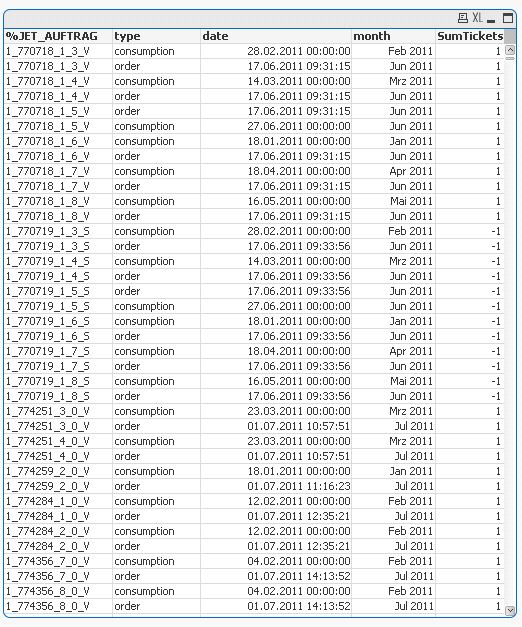
I transformed your table a bit, using the crosstable prefix, in order to get one single date column.
By this you should keep the possibility to further analyse the data using your other dimensions.
Here is the code:
tabData:
CrossTable (type, date, 2)
LOAD
%JET_AUFTRAG,
SumTickets,
auftrag_datum as order,
addmonths(vorst_datum,-12) as consumption
FROM
(biff, embedded labels);
Left Join
LOAD Distinct
date,
MonthName(date) as month
Resident tabData;
hope this helps
Gruß
Marco
- Mark as New
- Bookmark
- Subscribe
- Mute
- Subscribe to RSS Feed
- Permalink
- Report Inappropriate Content
Hi Benedikt,
Please check out the attached and see if it helps. There wasn't enough data to get proper resuts but with a full data set it should be fine. You can test it out and see.
Thanks
AJ
- Mark as New
- Bookmark
- Subscribe
- Mute
- Subscribe to RSS Feed
- Permalink
- Report Inappropriate Content
Hi Ajay,
thanks for the quick reply, it's cool to display it for a dashboard, but I'd like to keep the possibility to further analyse the data, which I loose if I pre-aggregate the data.
The whole dataset is arranged as star-topology and contains some master data about the orders and customers and so on, therefore, I'm looking for something similar to a if-statement but with better calculation times.
Thanks!
Benedikt
- Mark as New
- Bookmark
- Subscribe
- Mute
- Subscribe to RSS Feed
- Permalink
- Report Inappropriate Content
Hallo Benedikt,
maybe this is what you are looking for:
I transformed your table a bit, using the crosstable prefix, in order to get one single date column.
By this you should keep the possibility to further analyse the data using your other dimensions.
Here is the code:
tabData:
CrossTable (type, date, 2)
LOAD
%JET_AUFTRAG,
SumTickets,
auftrag_datum as order,
addmonths(vorst_datum,-12) as consumption
FROM
(biff, embedded labels);
Left Join
LOAD Distinct
date,
MonthName(date) as month
Resident tabData;
hope this helps
Gruß
Marco