Unlock a world of possibilities! Login now and discover the exclusive benefits awaiting you.
- Qlik Community
- :
- All Forums
- :
- QlikView App Dev
- :
- Re: Chart not able to display till Dec for YOY com...
- Subscribe to RSS Feed
- Mark Topic as New
- Mark Topic as Read
- Float this Topic for Current User
- Bookmark
- Subscribe
- Mute
- Printer Friendly Page
- Mark as New
- Bookmark
- Subscribe
- Mute
- Subscribe to RSS Feed
- Permalink
- Report Inappropriate Content
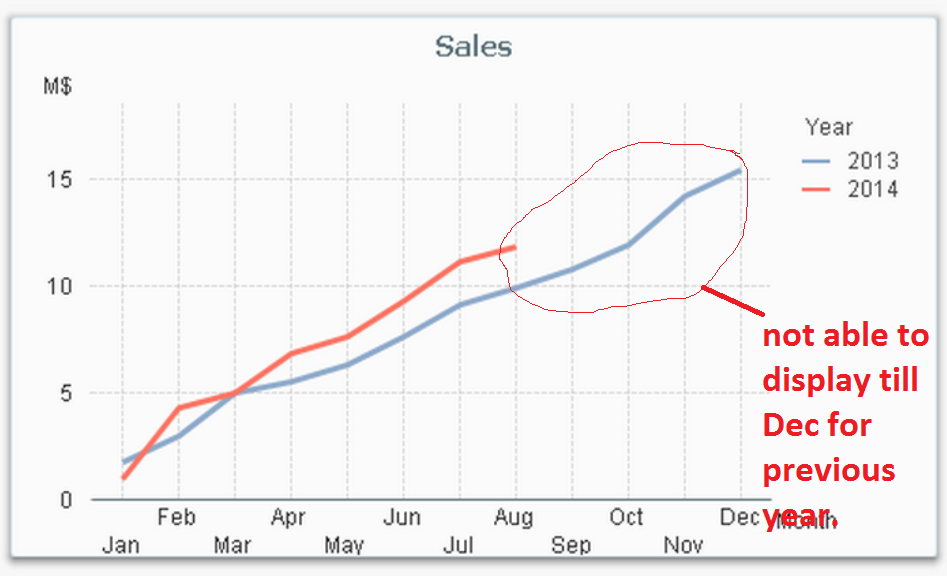
Chart not able to display till Dec for YOY compare from HIC on recent blog post
Hi All
I have try to add 1 script on my calendar script . and also expression script for below chart. it work fine , just that it only plot the sales from Jan till march. what i need is for previous year 2013 , i want the green line to display all the way till Dec . Hope some one can share with me how to achieve this ?
Accepted Solutions
- Mark as New
- Bookmark
- Subscribe
- Mute
- Subscribe to RSS Feed
- Permalink
- Report Inappropriate Content
For that chart you don't need to worry about Year To Date, as you are showing lines that you can track forward.
Change your expression to Sum( sales ) and it will work.
If you were comparing YTD figures, and then getting a total variance (for instance), you would need to use the expression you have of Sum( {$<IsInYTD={1}>}sales ) . This way you are looking at the same date period for both years and one over the other makes sense, eg:
Sum( {$<IsInYTD={1},Year={'$(=max(Year)'}>}sales ) / Sum( {$<IsInYTD={1},Year={'$(=max(Year)-1'}>}sales )
Hope that helps explain.
- Steve
- Mark as New
- Bookmark
- Subscribe
- Mute
- Subscribe to RSS Feed
- Permalink
- Report Inappropriate Content
Hi All enclosed is my QV doc.
- Mark as New
- Bookmark
- Subscribe
- Mute
- Subscribe to RSS Feed
- Permalink
- Report Inappropriate Content
For that chart you don't need to worry about Year To Date, as you are showing lines that you can track forward.
Change your expression to Sum( sales ) and it will work.
If you were comparing YTD figures, and then getting a total variance (for instance), you would need to use the expression you have of Sum( {$<IsInYTD={1}>}sales ) . This way you are looking at the same date period for both years and one over the other makes sense, eg:
Sum( {$<IsInYTD={1},Year={'$(=max(Year)'}>}sales ) / Sum( {$<IsInYTD={1},Year={'$(=max(Year)-1'}>}sales )
Hope that helps explain.
- Steve
- Mark as New
- Bookmark
- Subscribe
- Mute
- Subscribe to RSS Feed
- Permalink
- Report Inappropriate Content
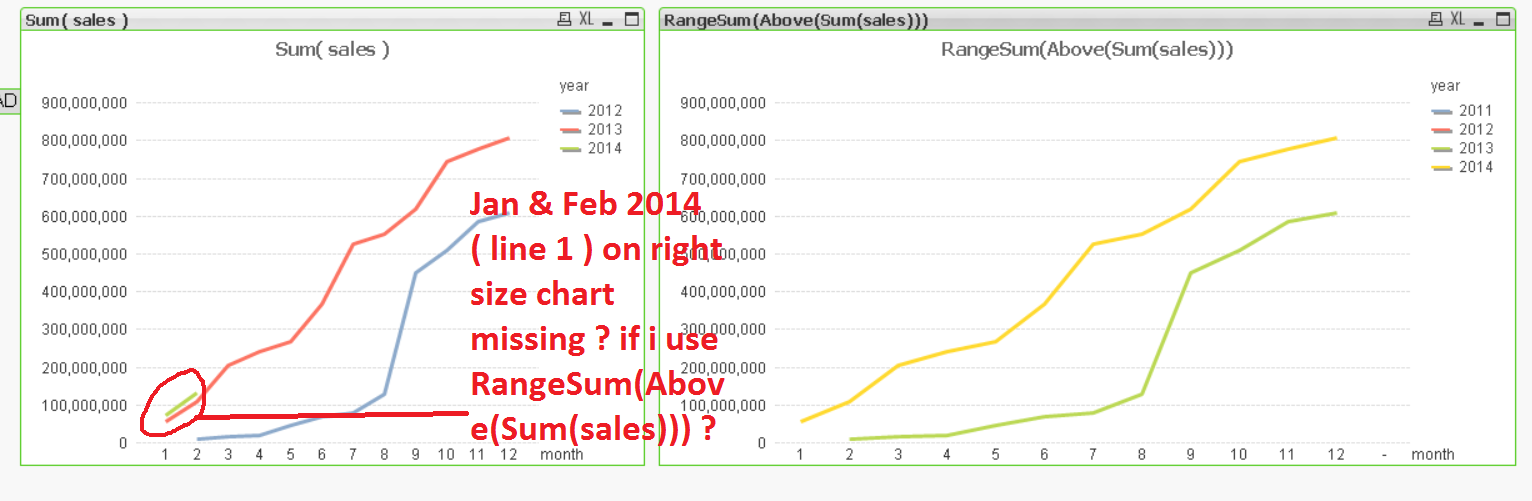
In this chart I have not used any flags or any set analysis. It is just a plain accumulation of the values, which you can do either the simple way on the expression tab, or by using a RangeSum(Above(Sum(Sales))).
The message is that you can make a YoY without any flags or set analysis if you use month as 1st dimension, but as soon as you want another field as dimension, you need to use flags and/or set analysis.
HIC
- Mark as New
- Bookmark
- Subscribe
- Mute
- Subscribe to RSS Feed
- Permalink
- Report Inappropriate Content
Hi All
Thank you very much for your advise.
Hi HIC
Why i use you expression 2014 line missing ?
Paul