Unlock a world of possibilities! Login now and discover the exclusive benefits awaiting you.
- Qlik Community
- :
- All Forums
- :
- QlikView App Dev
- :
- Re: Create a Bar for the Average
- Subscribe to RSS Feed
- Mark Topic as New
- Mark Topic as Read
- Float this Topic for Current User
- Bookmark
- Subscribe
- Mute
- Printer Friendly Page
- Mark as New
- Bookmark
- Subscribe
- Mute
- Subscribe to RSS Feed
- Permalink
- Report Inappropriate Content
Create a Bar for the Average
Hi All,
I am looking to do something similar to this in Qlikview
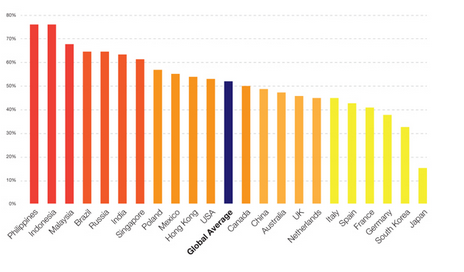
I have tried using an Expression and playing with the Dimension Limits, but I can't get the look that I need.
Has anyone created anything similar
Regards
Alan
Accepted Solutions
- Mark as New
- Bookmark
- Subscribe
- Mute
- Subscribe to RSS Feed
- Permalink
- Report Inappropriate Content
You can do it with a valuelist() function (synthetic dimension). The chart itself is not select-able, but the chart is fully dynamic and responds to any other selections. Also a good example of using colormix wizard.
- Mark as New
- Bookmark
- Subscribe
- Mute
- Subscribe to RSS Feed
- Permalink
- Report Inappropriate Content
You must compute average value in the script, then it automatically displays as you need
- Mark as New
- Bookmark
- Subscribe
- Mute
- Subscribe to RSS Feed
- Permalink
- Report Inappropriate Content
You could use something like the following script, use Country.DimOrder in your (set) expression to control what to display and how to format it.
[Country]:
CrossTable('Country.Dim','Country.DimOrder',1)
Load @1:8 as [Id],
if(Country=1,'1') as [Austria],
if(Country=1,'-1') as [Europe],
if(Country=2,'2') as [Belgium],
if(Country=2,'-1') as [Europe],
if(Country=3,'3') as [Czech Republic],
if(Country=3,'-1') as [Europe],
if(Country=4,'4') as [Denmark],
if(Country=4,'-1') as [Europe],
if(Country=5,'5') as [Finland],
if(Country=5,'-1') as [Europe],
if(Country=6,'6') as [France],
if(Country=6,'-1') as [Europe],
if(Country=7,'7') as [Germany],
if(Country=7,'-1') as [Europe],
if(Country=8,'8') as [Greece],
if(Country=8,'-1') as [Europe],
if(Country=9,'9') as [Hungary],
if(Country=9,'-1') as [Europe],
if(Country=11,'11') as [Italy],
if(Country=11,'-1') as [Europe],
if(Country=12,'12') as [Netherlands],
if(Country=12,'-1') as [Europe],
if(Country=13,'13') as [Norway],
if(Country=13,'-1') as [Europe],
if(Country=14,'14') as [Poland],
if(Country=14,'-1') as [Europe],
if(Country=15,'15') as [Portugal],
if(Country=15,'-1') as [Europe],
if(Country=16,'16') as [Spain],
if(Country=16,'-1') as [Europe],
if(Country=17,'17') as [Sweden],
if(Country=17,'-1') as [Europe],
if(Country=18,'18') as [Switzerland],
if(Country=18,'-1') as [Europe],
if(Country=19,'19') as [Uk],
if(Country=19,'-1') as [Europe],
if(Country=31,'31') as [Turkey],
if(Country=31,'-1') as [Eurasia],
if(Country=41,'41') as [Russia],
if(Country=41,'-1') as [Eurasia],
from file;
- Mark as New
- Bookmark
- Subscribe
- Mute
- Subscribe to RSS Feed
- Permalink
- Report Inappropriate Content
Why would you not put the global average on as a line rather than a bar, that way it would be easy?
Could you achieve something like this by creating a table linking into your data model, with a global average field linking to all values?
GlobalAverage:
LOAD DISTINCT
Country,
Country as [Global Average Country]
RESIDENT ExistingTable;
GlobalAverage:
LOAD DISTINCT
Country,
'Global Average' as [Global Average Country]
RESIDENT ExistingTable;
This way each country would exist in the table linking to itself, and then again linking to the average.
All you should then need to do is change your dimension from Country to Global Average Country.
I've not given it a try - but I don't see why this wouldn't achieve what you are after.
- Steve
- Mark as New
- Bookmark
- Subscribe
- Mute
- Subscribe to RSS Feed
- Permalink
- Report Inappropriate Content
Thanks Steve,
I can add a Average line very easily, I just like the look of having the Average as the Bar
I will try what you have suggested and revert
Regards
Alan
- Mark as New
- Bookmark
- Subscribe
- Mute
- Subscribe to RSS Feed
- Permalink
- Report Inappropriate Content
You can do it with a valuelist() function (synthetic dimension). The chart itself is not select-able, but the chart is fully dynamic and responds to any other selections. Also a good example of using colormix wizard.
- Mark as New
- Bookmark
- Subscribe
- Mute
- Subscribe to RSS Feed
- Permalink
- Report Inappropriate Content
Excellent Thanks
- Mark as New
- Bookmark
- Subscribe
- Mute
- Subscribe to RSS Feed
- Permalink
- Report Inappropriate Content
Hi Alan,
After thinking about this question, and other times where values can be aggregated in the data model by generating extra dimensions, I put together this blog post: http://bit.ly/1nkhVi4
It contains example code for creating accumulations, moving annual totals and average bars - with a downloadable QlikView app illustrating the methods.
Hope you find it useful.
Steve
- Mark as New
- Bookmark
- Subscribe
- Mute
- Subscribe to RSS Feed
- Permalink
- Report Inappropriate Content
Thanks again Steve.