Unlock a world of possibilities! Login now and discover the exclusive benefits awaiting you.
- Qlik Community
- :
- All Forums
- :
- QlikView App Dev
- :
- Re: Top Contributing Customers of 50% Sales
- Subscribe to RSS Feed
- Mark Topic as New
- Mark Topic as Read
- Float this Topic for Current User
- Bookmark
- Subscribe
- Mute
- Printer Friendly Page
- Mark as New
- Bookmark
- Subscribe
- Mute
- Subscribe to RSS Feed
- Permalink
- Report Inappropriate Content
Top Contributing Customers of 50% Sales
Hello Everyone,
I would like to find out Top Contributing customers who's sales is 50% of total sales, Please see attached document for your consideration.
Requirement
1. Count No of Customers, Result 2
2. List of Customers : H, B
3. Total Sales : 10,350
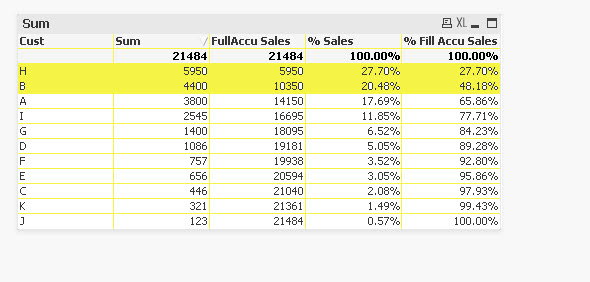
So for 50% of total revenue generating customers are H and B,
Thank you in advance for you help.
Dev
- Mark as New
- Bookmark
- Subscribe
- Mute
- Subscribe to RSS Feed
- Permalink
- Report Inappropriate Content
Hi,
You can achieve this by go to
chart Properties->dimension Limit->tick(Restrict values)->show only values that are->greater than->50%
Please appreciate our Qlik community members by giving Kudos for sharing their time for your query. If your query is answered, please mark the topic as resolved 🙂
- Mark as New
- Bookmark
- Subscribe
- Mute
- Subscribe to RSS Feed
- Permalink
- Report Inappropriate Content
Thanks,
I have to show it in Text Objects. This is basic requirement then I have to do more presentation of data in bar chart and pie chart with different dimensions.
- Mark as New
- Bookmark
- Subscribe
- Mute
- Subscribe to RSS Feed
- Permalink
- Report Inappropriate Content
I think this requirement implies the same as ABC Analysis. However as you can see in these discussions:
Re: ABC analysis & letting user to sort straight table as he likes?
It's not possible to sort values in the fly using SetAnalysis or anything else, so the only ways to accomplish this kind of requirements is using a straight table and sort the values or precalculate all possible results in the Script.
- Mark as New
- Bookmark
- Subscribe
- Mute
- Subscribe to RSS Feed
- Permalink
- Report Inappropriate Content
Thank you all, I hope there was a way to display this information in Text object, Even I can not get the count of Customers and Total sales for the customers contributing Top 80% 


- Mark as New
- Bookmark
- Subscribe
- Mute
- Subscribe to RSS Feed
- Permalink
- Report Inappropriate Content
I had a similar requirement a few weeks back and Ajay Prabhakaran was able to help... It might work for you. Try Help with Select in Field Trigger
Instead of select in field, you might be able to modify it to simply display the Customers' names.
Mike
www.FortuneCookieBI.com
- Mark as New
- Bookmark
- Subscribe
- Mute
- Subscribe to RSS Feed
- Permalink
- Report Inappropriate Content
Thanks Mike,
This is not by rank, It is similar 80/20 rule, Count of Customers who contribute (Revenue or Sales) to 80% of total Revenue or Sales.