Unlock a world of possibilities! Login now and discover the exclusive benefits awaiting you.
- Qlik Community
- :
- All Forums
- :
- QlikView App Dev
- :
- Visually separate 2 dimensions in chart
- Subscribe to RSS Feed
- Mark Topic as New
- Mark Topic as Read
- Float this Topic for Current User
- Bookmark
- Subscribe
- Mute
- Printer Friendly Page
- Mark as New
- Bookmark
- Subscribe
- Mute
- Subscribe to RSS Feed
- Permalink
- Report Inappropriate Content
Visually separate 2 dimensions in chart
Hi,
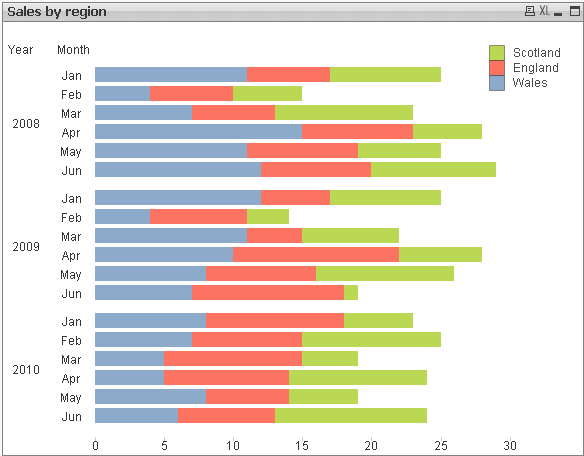
Does anyone know a way to visually separate the values of 2 dimensions in a bar chart, just like excel...
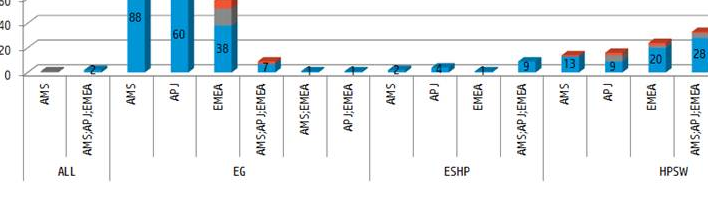
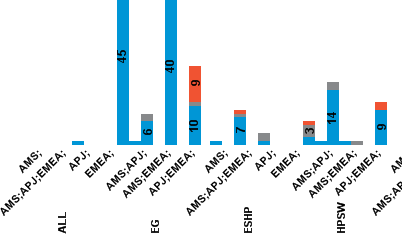
Instead of this in QV (it's not really clear)
- Mark as New
- Bookmark
- Subscribe
- Mute
- Subscribe to RSS Feed
- Permalink
- Report Inappropriate Content
Hi Oscar,
basically, just like that: On the "axes" tab of the dialog, you can select to have each of your dimensions
- horizontally
- vertically or
- diagonal
QlikView will separate these vertically. You might have to play around a bit with the different "areas" inside your charting_area - press Ctrl+Shift in the area and you'll see them as red squares.
HTH
Best regards,
DataNibbler
- Mark as New
- Bookmark
- Subscribe
- Mute
- Subscribe to RSS Feed
- Permalink
- Report Inappropriate Content
There just one chart area when I press ctrl+shift, and I already have one dimension in diagonal one horizontal, as seen in the image 
- Mark as New
- Bookmark
- Subscribe
- Mute
- Subscribe to RSS Feed
- Permalink
- Report Inappropriate Content
Perhaps changing the orientation is an option:
talk is cheap, supply exceeds demand
- Mark as New
- Bookmark
- Subscribe
- Mute
- Subscribe to RSS Feed
- Permalink
- Report Inappropriate Content
Or playing with the bar settings in presentation tab may help to create more distance between the bars. another thing you could do is limit the number of dimensions displayed and provide a scroll bar and may be sort descending as well.