Unlock a world of possibilities! Login now and discover the exclusive benefits awaiting you.
- Qlik Community
- :
- All Forums
- :
- QlikView App Dev
- :
- Re: Aggregation by Name
- Subscribe to RSS Feed
- Mark Topic as New
- Mark Topic as Read
- Float this Topic for Current User
- Bookmark
- Subscribe
- Mute
- Printer Friendly Page
- Mark as New
- Bookmark
- Subscribe
- Mute
- Subscribe to RSS Feed
- Permalink
- Report Inappropriate Content
Aggregation by Name
Hi and thank you in advance for any assistance! 
I am currently attempting to create a chart to measure the number of different coaches that have coached advisors (grouped by sum totals) against the % of focuses that have improved (grouped by sum of total coaches and averaged by the count of each sum). I have been told that I need to create an aggregation for my "Num of Diff 1-2-1 Coaches" expression, so that I can set this as the dimension in my chart, but I've not used the Aggr function before and can't seem to figure it out.
I hope this makes sense!
The dimension is:
Non-Group Advisors
=IF([Prob Group]<>1 and [Est Group]<>1,[Advisor Name])
The expressions are currently thus:
Num of Diff 1-2-1 Coaches
Count({$<[Focus]-={1,2,29,30,31,40},[Est Group]={""},[Prob Group]={""}>}DISTINCT Coach)
% of Focuses Improved
Sum(Improved?)/Count({$<[Focus]-={1,2,29,30,31,40},[Est Group]={""},[Prob Group]={""}>}DISTINCT Focus)
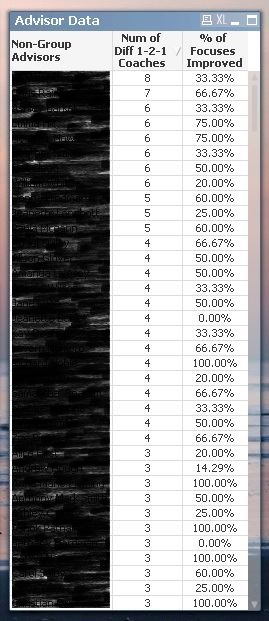
This produces this table (advisor names covered):
Accepted Solutions
- Mark as New
- Bookmark
- Subscribe
- Mute
- Subscribe to RSS Feed
- Permalink
- Report Inappropriate Content
Have now resolved final issue! (with help of a colleague)
Sum(Aggr((Sum (Improved?)/Count({$<[Focus]-={1,2,29,30,31,40},[Est Group]={""},[Prob Group]={""}>}DISTINCT Focus)),[Advisor Name]))
/ count(aggr(Count({$<[Focus]-={1,2,29,30,31,40},[Est Group]={""},[Prob Group]={""}>}DISTINCT Coach),[Advisor Name]))
Many thanks for your assistance 🙂
- Mark as New
- Bookmark
- Subscribe
- Mute
- Subscribe to RSS Feed
- Permalink
- Report Inappropriate Content
Sorry, I don't understand it. Perhaps you can post a sample document with data and an example calculation for an advisor.
talk is cheap, supply exceeds demand
- Mark as New
- Bookmark
- Subscribe
- Mute
- Subscribe to RSS Feed
- Permalink
- Report Inappropriate Content
Hi Gysbert,
The document is pretty complex with a number of different tables feeding into it, so it would be rather difficult for me to create sample data to match.
What I would like to have is the table pictured in the original post, but with the "Num of Diff 1-2-1 Coaches" as the dimension, rather than "Non-Group Advisors".
The "Num of Diff 1-2-1 Coaches" looks at the number of distinct coaches that have coached each distinct advisor - this is calculated by doing a distinct count of the coaches names on each row for each advisor, excluding certain focus fields and (established/probationary) group session flags.
The "% of Focuses Improved" expression takes the sum of the "Improved?" flag (if the advisor has improved, the column reads 1), then divides this by a distinct count of the foci used when coaching this advisor, e.g. if 4 different foci have been used when coaching the advisor and they have improved on 1 focus, the result will be 25%
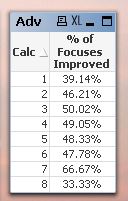
The resulting table should look something like:
8 33.33%
7 66.67%
6 47.78%
5 60.00%
4 53.67%
3 80.67%
2 90.00%
1 10.00%
I hope this sheds a little light and I will see if it is possible to get some test data together at some point.
- Mark as New
- Bookmark
- Subscribe
- Mute
- Subscribe to RSS Feed
- Permalink
- Report Inappropriate Content
So you want to use a calculated dimension. Be aware that those can be very costly in terms of performance.
Try: aggr( Count({$<[Focus]-={1,2,29,30,31,40},[Est Group]={""},[Prob Group]={""}>}DISTINCT Coach), [Advisor Name])
talk is cheap, supply exceeds demand
- Mark as New
- Bookmark
- Subscribe
- Mute
- Subscribe to RSS Feed
- Permalink
- Report Inappropriate Content
Thanks Gysbert 🙂
Managed to get to that bit myself (in the end) but now the tricky part is doing an average of the % improvements. I have been trying to do double aggregation to calculate the average of the % for the calculated dimension, but I'm stumped (as is my boss).
So, I need to now find the average % of focuses improved for each number that the aggregated calculated dimention holds, based on the total count of advisors that have had that number of coaches.
The closest I have gotten so far is this:
Sum (Improved?)/Count({$<[Focus]-={1,2,29,30,31,40},[Est Group]={""},[Prob Group]={""}>}DISTINCT Focus))
/Count(aggr(Count({$<[Focus]-={1,2,29,30,31,40},[Est Group]={""},[Prob Group]={""}>}DISTINCT Coach),[Advisor Name]))
- Mark as New
- Bookmark
- Subscribe
- Mute
- Subscribe to RSS Feed
- Permalink
- Report Inappropriate Content
Have now resolved final issue! (with help of a colleague)
Sum(Aggr((Sum (Improved?)/Count({$<[Focus]-={1,2,29,30,31,40},[Est Group]={""},[Prob Group]={""}>}DISTINCT Focus)),[Advisor Name]))
/ count(aggr(Count({$<[Focus]-={1,2,29,30,31,40},[Est Group]={""},[Prob Group]={""}>}DISTINCT Coach),[Advisor Name]))
Many thanks for your assistance 🙂