Unlock a world of possibilities! Login now and discover the exclusive benefits awaiting you.
- Qlik Community
- :
- All Forums
- :
- QlikView App Dev
- :
- Re: Re: 100% Stacked bar chart
- Subscribe to RSS Feed
- Mark Topic as New
- Mark Topic as Read
- Float this Topic for Current User
- Bookmark
- Subscribe
- Mute
- Printer Friendly Page
- Mark as New
- Bookmark
- Subscribe
- Mute
- Subscribe to RSS Feed
- Permalink
- Report Inappropriate Content
100% Stacked bar chart
Hi,
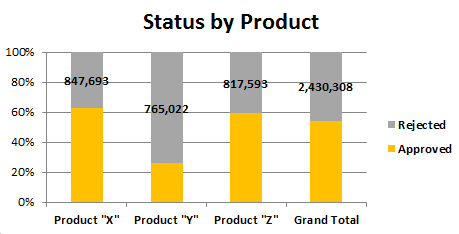
Does anyone know how to create a '100% stacked bar' chart in a way, that tool compares the % not to the total, but to the reported groups? I.e.: sum(Product "X")=100%
| Product "X" | Product "Y" | Product "Z" | Grand Total | |
| Approved | 1,427,075 | 267,717 | 1,189,907 | 2,884,699 |
| Rejected | 847,693 | 765,022 | 817,593 | 2,430,308 |
And is it possible in any way to have both, the values and the % visible in the same chart? Or at least add the values into a % bar chart? Many thanks for your help!
Message was edited by: Prakash Pawar
Accepted Solutions
- Mark as New
- Bookmark
- Subscribe
- Mute
- Subscribe to RSS Feed
- Permalink
- Report Inappropriate Content
- Mark as New
- Bookmark
- Subscribe
- Mute
- Subscribe to RSS Feed
- Permalink
- Report Inappropriate Content
Hey Prakash, can you attach a sample file if possible.
I think you can add another expression and make it text. Then you would have a bar in % and a value in text.
- Mark as New
- Bookmark
- Subscribe
- Mute
- Subscribe to RSS Feed
- Permalink
- Report Inappropriate Content
Hi Prakash,
maybe you find this solution helpful?
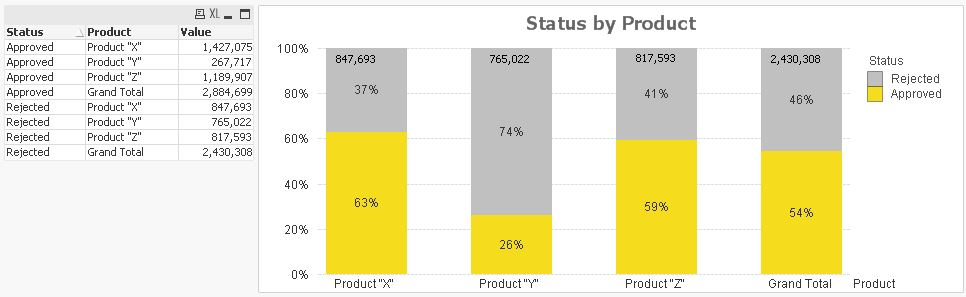
Chart Dimensions:
- Product
- Status
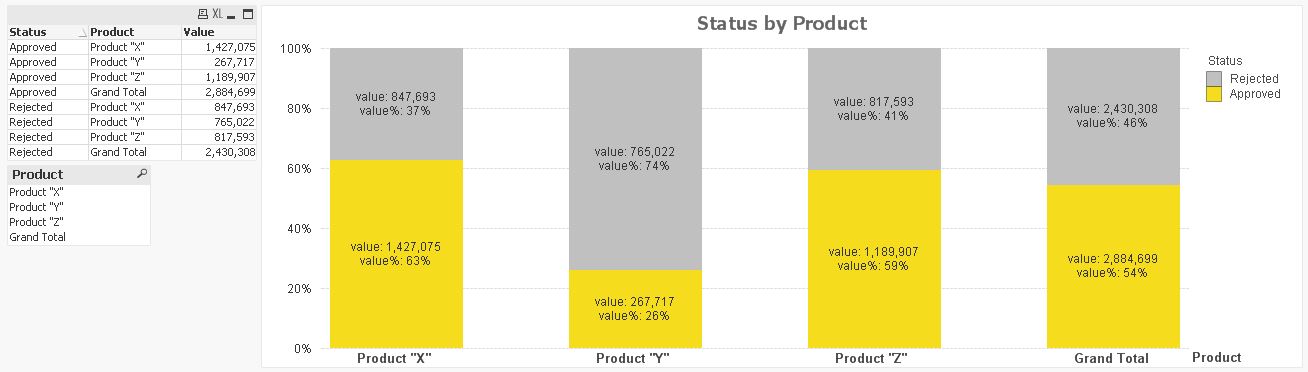
Chart Expression:
=sum(Value)/sum(Total<Product> Value)
The trick is to only total all chart dimension except the Product dimension, which in this case leaves only the Status dimension.
Load script:
CrossTable(Product, Value)
LOAD F1 as Status,
     [Product "X"],
     [Product "Y"],
     [Product "Z"],
     [Grand Total]
FROM
[http://community.qlik.com/thread/111482]
(html, codepage is 1252, embedded labels, table is @1);
I had to transform your table a bit (crosstable load).
Hope you don't mind 
regards
Marco
- Mark as New
- Bookmark
- Subscribe
- Mute
- Subscribe to RSS Feed
- Permalink
- Report Inappropriate Content
Chek the option 'values on data points' on the expression tab and also the 'Plot values inside the segments' in the presentation tab.
- Mark as New
- Bookmark
- Subscribe
- Mute
- Subscribe to RSS Feed
- Permalink
- Report Inappropriate Content
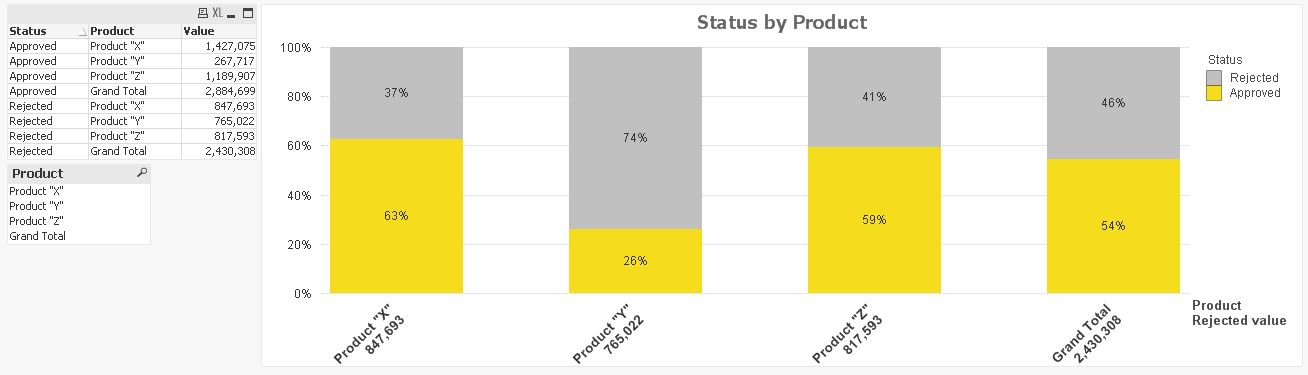
one more flexible way, using a calculated dimension that includes the rejected value:
=Product&chr(10)&num(aggr(Sum({$<Status={'Rejected'}>}Value), Product), '#,##0')
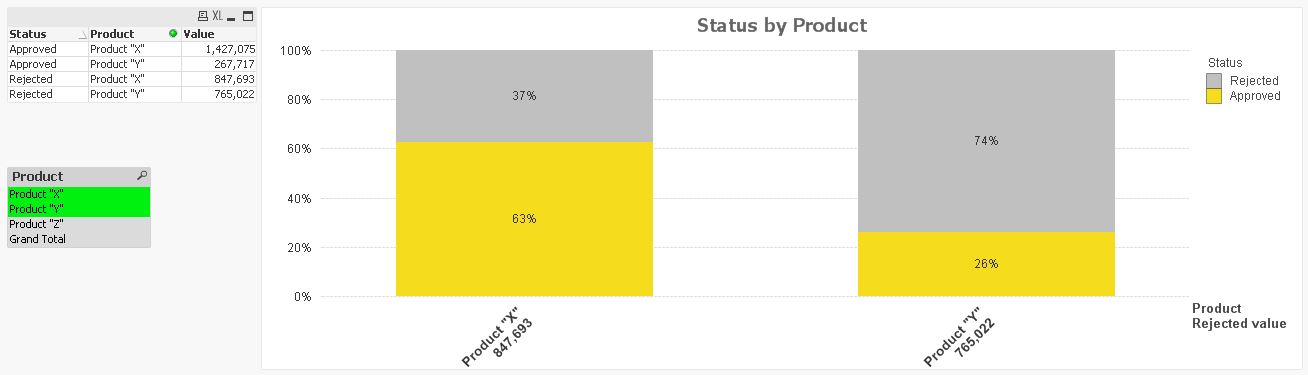
regards
Marco
- Mark as New
- Bookmark
- Subscribe
- Mute
- Subscribe to RSS Feed
- Permalink
- Report Inappropriate Content
or maybe this one?
regards
Marco