Unlock a world of possibilities! Login now and discover the exclusive benefits awaiting you.
- Qlik Community
- :
- All Forums
- :
- QlikView App Dev
- :
- Re: Overlap Bars on a chart
- Subscribe to RSS Feed
- Mark Topic as New
- Mark Topic as Read
- Float this Topic for Current User
- Bookmark
- Subscribe
- Mute
- Printer Friendly Page
- Mark as New
- Bookmark
- Subscribe
- Mute
- Subscribe to RSS Feed
- Permalink
- Report Inappropriate Content
Overlap Bars on a chart
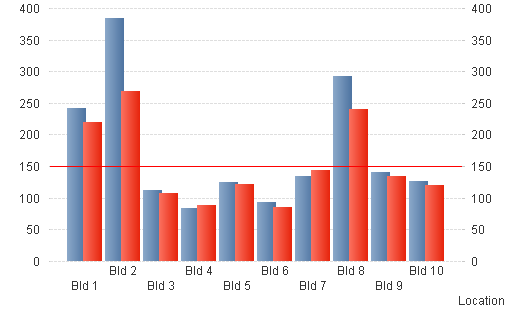
Hi I'm trying to force bars on a chart to overlap. This requires the front bar to be thinner that theone behind.
This is what I have so far but can't get the bars to overlap fully.
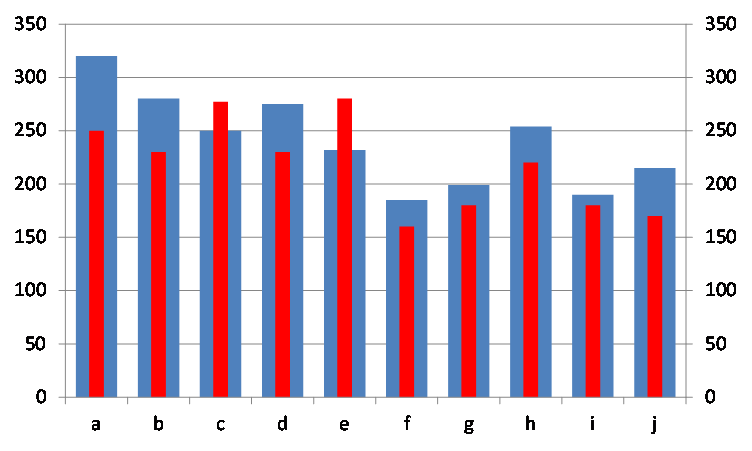
This is what I was hoping for.
Appreciate any help.
Thanks
Rob
- « Previous Replies
-
- 1
- 2
- Next Replies »
- Mark as New
- Bookmark
- Subscribe
- Mute
- Subscribe to RSS Feed
- Permalink
- Report Inappropriate Content
Hi,
You can go to the Chart Properties - Style tab and select subtype as Stacked.
Please find attachment.
Hope this helps.
Regards,
-Khaled
- Mark as New
- Bookmark
- Subscribe
- Mute
- Subscribe to RSS Feed
- Permalink
- Report Inappropriate Content
Hi
I dont think that you can get to that chart style directly. It may be possible by overlaying the red bar chart on top of the blue one - but its tricky to get such overlapped objects to behave nicely when the user interacts with them.
Hope that helps
Jonathan
- Mark as New
- Bookmark
- Subscribe
- Mute
- Subscribe to RSS Feed
- Permalink
- Report Inappropriate Content
The closest thing I can think of is the bullet chart extension.
See this example document under the Bullet Chart tab:
This is a bullet chart extension thread with an extension available for download:
- Mark as New
- Bookmark
- Subscribe
- Mute
- Subscribe to RSS Feed
- Permalink
- Report Inappropriate Content
Hi Jonathan, I was trying overlapping two charts but it does get messy.
- Mark as New
- Bookmark
- Subscribe
- Mute
- Subscribe to RSS Feed
- Permalink
- Report Inappropriate Content
Johannes, the bullet chart looks an interesting concept and may help illustrate the results better than I was hoping.
How do I get the extention?
Thanks
Rob
- Mark as New
- Bookmark
- Subscribe
- Mute
- Subscribe to RSS Feed
- Permalink
- Report Inappropriate Content
Hi Rob, did you figure this one out?
I'm having the exact same problem. I've got one bar chart object overlapping another bar chart object, which works fine until you select a dimension with more than ~30 values, at which point the two charts stop lining up... seems a shame that such basic Excel functionality isn't present in Qlikview!
- Mark as New
- Bookmark
- Subscribe
- Mute
- Subscribe to RSS Feed
- Permalink
- Report Inappropriate Content
No I couldn't get it to work! may be something we suggest to Qlikview as one of their basic features.
Thanks
Rob
- Mark as New
- Bookmark
- Subscribe
- Mute
- Subscribe to RSS Feed
- Permalink
- Report Inappropriate Content
Hi,
On the propertys chart, you can use negatives numbers on the presentation tab (like -4, for example).
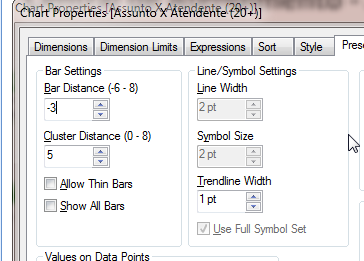
Tks,
André
- Mark as New
- Bookmark
- Subscribe
- Mute
- Subscribe to RSS Feed
- Permalink
- Report Inappropriate Content
I'll second that request!
- « Previous Replies
-
- 1
- 2
- Next Replies »