Unlock a world of possibilities! Login now and discover the exclusive benefits awaiting you.
- Qlik Community
- :
- All Forums
- :
- QlikView App Dev
- :
- Re: bar chart
- Subscribe to RSS Feed
- Mark Topic as New
- Mark Topic as Read
- Float this Topic for Current User
- Bookmark
- Subscribe
- Mute
- Printer Friendly Page
- Mark as New
- Bookmark
- Subscribe
- Mute
- Subscribe to RSS Feed
- Permalink
- Report Inappropriate Content
bar chart
Hi everyone,
from the sample data below ,
Month | Prod | Stock |
Feb | A | 10 |
Feb | B | 20 |
Feb | C | 30 |
Feb | D | 40 |
Mar | A | 20 |
Mar | B | 39 |
Mar | C | 34 |
Mar | D | 23 |
i created this bar chart :
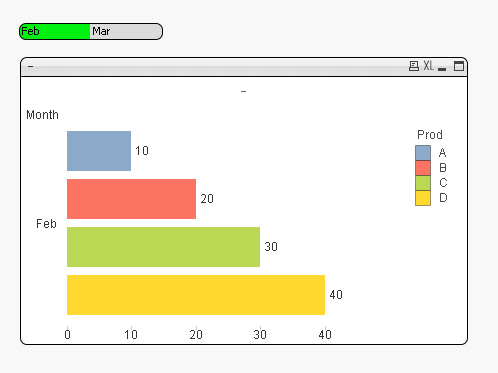
and now i want to know if it's possible to add a fifth (horizontal) bar to the chart (same chart) for the average ( Month : feb )
Thanks
- « Previous Replies
-
- 1
- 2
- Next Replies »
- Mark as New
- Bookmark
- Subscribe
- Mute
- Subscribe to RSS Feed
- Permalink
- Report Inappropriate Content
Will this do?
Thanks,
Prabhu
- Mark as New
- Bookmark
- Subscribe
- Mute
- Subscribe to RSS Feed
- Permalink
- Report Inappropriate Content
i know this method but i want to add a horizontal bar
- Mark as New
- Bookmark
- Subscribe
- Mute
- Subscribe to RSS Feed
- Permalink
- Report Inappropriate Content
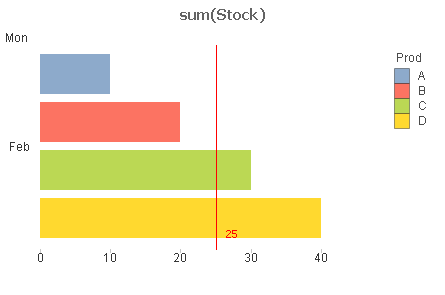
Hi
There is no option in bar chart. You can use the reference line
And increase the weight as per attached file
Please close the thread by marking correct answer & give likes if you like the post.
- Mark as New
- Bookmark
- Subscribe
- Mute
- Subscribe to RSS Feed
- Permalink
- Report Inappropriate Content
Chk it out
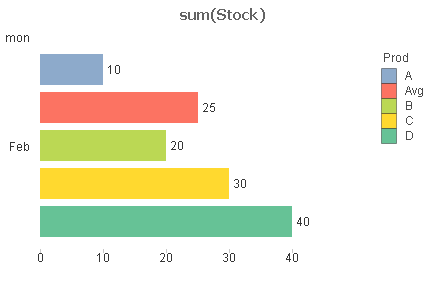
test:
LOAD * INLINE [
mon, Prod, Stock
Feb, A, 10
Feb, B, 20
Feb, C, 30
Feb, D, 40
Mar, A, 20
Mar, B, 39
Mar, C, 34
Mar, D, 23
];
Concatenate
load mon, 'Avg' as Prod, avg(Stock) as Stock
Resident test
Group by mon;
Thanks,
Prabhu
- Mark as New
- Bookmark
- Subscribe
- Mute
- Subscribe to RSS Feed
- Permalink
- Report Inappropriate Content
Like below... Please confirm... i will upload the trick...
Also, confirm which edition you are using ?
i.e. Licensed or Personal...
- Mark as New
- Bookmark
- Subscribe
- Mute
- Subscribe to RSS Feed
- Permalink
- Report Inappropriate Content
Please mark it as correct answer if the solution provided is suitable for you.
Thanks,
Prabhu
- Mark as New
- Bookmark
- Subscribe
- Mute
- Subscribe to RSS Feed
- Permalink
- Report Inappropriate Content
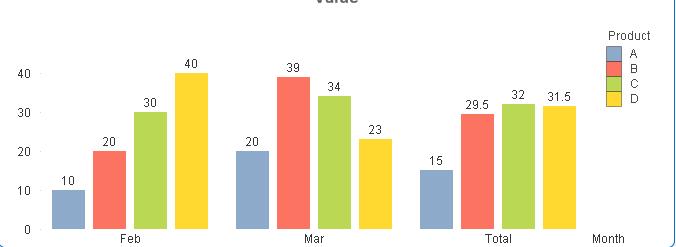
is there any method to get the same result using chart expression not in the load script ?
thnaks
- Mark as New
- Bookmark
- Subscribe
- Mute
- Subscribe to RSS Feed
- Permalink
- Report Inappropriate Content
thanks for your help but the results seems to be wrong !
- Mark as New
- Bookmark
- Subscribe
- Mute
- Subscribe to RSS Feed
- Permalink
- Report Inappropriate Content
What could be the result?
Kindly let me know, I will check and confirm back...
- « Previous Replies
-
- 1
- 2
- Next Replies »