Unlock a world of possibilities! Login now and discover the exclusive benefits awaiting you.
- Qlik Community
- :
- All Forums
- :
- QlikView App Dev
- :
- Re: bar chart
Options
- Subscribe to RSS Feed
- Mark Topic as New
- Mark Topic as Read
- Float this Topic for Current User
- Bookmark
- Subscribe
- Mute
- Printer Friendly Page
Turn on suggestions
Auto-suggest helps you quickly narrow down your search results by suggesting possible matches as you type.
Showing results for
Creator III
2014-03-31
06:48 AM
- Mark as New
- Bookmark
- Subscribe
- Mute
- Subscribe to RSS Feed
- Permalink
- Report Inappropriate Content
bar chart
Hi everyone,
from the sample data below ,
Month | Prod | Stock |
Feb | A | 10 |
Feb | B | 20 |
Feb | C | 30 |
Feb | D | 40 |
Mar | A | 20 |
Mar | B | 39 |
Mar | C | 34 |
Mar | D | 23 |
i created this bar chart :
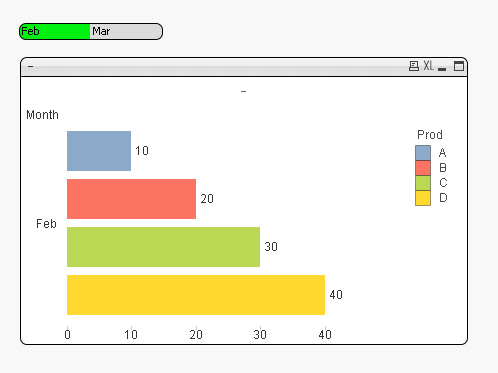
and now i want to know if it's possible to add a fifth (horizontal) bar to the chart (same chart) for the average ( Month : feb )
Thanks
951 Views
- « Previous Replies
-
- 1
- 2
- Next Replies »
14 Replies
Master III
2014-04-01
05:32 AM
- Mark as New
- Bookmark
- Subscribe
- Mute
- Subscribe to RSS Feed
- Permalink
- Report Inappropriate Content
You can add up the avg as Expression in UI
157 Views
Not applicable
2014-04-01
05:46 AM
- Mark as New
- Bookmark
- Subscribe
- Mute
- Subscribe to RSS Feed
- Permalink
- Report Inappropriate Content
I really doubt if we can bring the same using chart expressions
Thanks,
Prabhu
157 Views
MVP
2014-04-01
05:50 AM
- Mark as New
- Bookmark
- Subscribe
- Mute
- Subscribe to RSS Feed
- Permalink
- Report Inappropriate Content
Give me the result you want.
Believe me .... I can do it.. 
157 Views
Creator III
2014-04-01
07:05 AM
Author
- Mark as New
- Bookmark
- Subscribe
- Mute
- Subscribe to RSS Feed
- Permalink
- Report Inappropriate Content
exemple : for february the avg is 25
157 Views
Creator III
2014-04-01
07:09 AM
Author
- Mark as New
- Bookmark
- Subscribe
- Mute
- Subscribe to RSS Feed
- Permalink
- Report Inappropriate Content
don't work because i have 2 dimensions and the bar chart will be stacked instead of grouped
157 Views
- « Previous Replies
-
- 1
- 2
- Next Replies »