Unlock a world of possibilities! Login now and discover the exclusive benefits awaiting you.
- Qlik Community
- :
- All Forums
- :
- QlikView App Dev
- :
- Re: Re: Need to change Expression dynamically base...
- Subscribe to RSS Feed
- Mark Topic as New
- Mark Topic as Read
- Float this Topic for Current User
- Bookmark
- Subscribe
- Mute
- Printer Friendly Page
- Mark as New
- Bookmark
- Subscribe
- Mute
- Subscribe to RSS Feed
- Permalink
- Report Inappropriate Content
Need to change Expression dynamically based on a value in the dimension(not selection)
Hi Everyone,
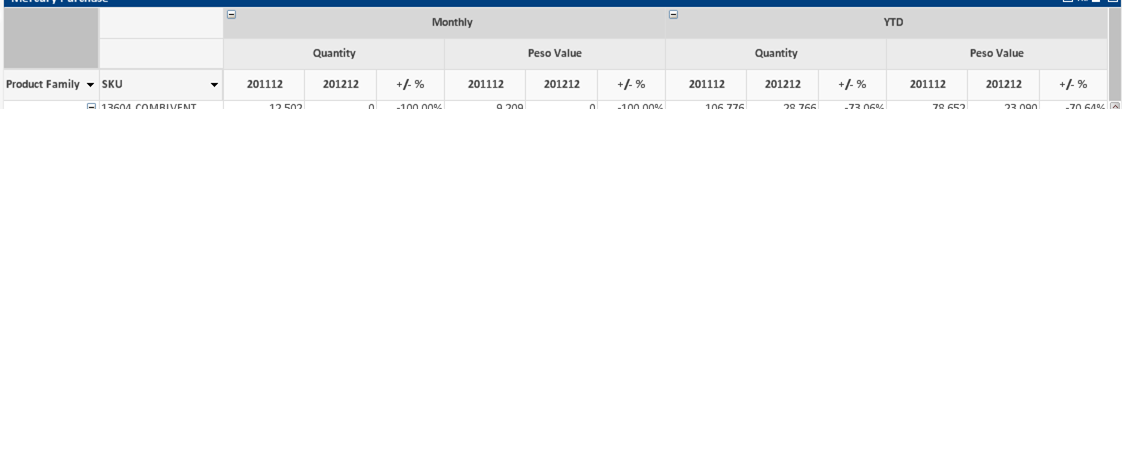
I actually have a very basic issue. I have a chart in which I am using 2 fields i.e Time (Monthly,YTD) and KPI (Sales, Target), coming from isolated Inline Tables as dimensions for labeling purpose only. As shown in the table below. Based on the Values of these fields, I need to changes the Expression Label.
| Monthly | Monthly | Monthly | Monthly | YTD | YTD | YTD | YTD |
|---|---|---|---|---|---|---|---|
| Sales | Sales | Target | Target | Sales | Sales | Target | Target |
| 201212 | 201312 | 201212 | 201312 | 2012 | 2013 | 2012 | 2013 |
| 4545 | 5656 | 566 | 676 | 766 | 6767 | 676 | 676 |
So, I am keeping only one expression and using 'If else' statement, putting 4 logic inside it. However I am not able to achieve the same thing for Labels.
If you see the above table for YTD, labels are only years i.e. 2012 & 2013.
Would appreciate the help and suggestions.
Thanks,
Neelam
- Mark as New
- Bookmark
- Subscribe
- Mute
- Subscribe to RSS Feed
- Permalink
- Report Inappropriate Content
Hi.
Could you describe what you're trying to achieve ?
- Mark as New
- Bookmark
- Subscribe
- Mute
- Subscribe to RSS Feed
- Permalink
- Report Inappropriate Content
Use the same logic to describe the label too.
- Mark as New
- Bookmark
- Subscribe
- Mute
- Subscribe to RSS Feed
- Permalink
- Report Inappropriate Content
Hi,
Please refer to the table which I have drawn below. So for monthly the captions are perfectly fine. But if you see YTD, the Captions should be 2011, 2012 i.e only Year.
I have 3 expressions in this chart in which I am putting If Else logic using two fields Time(First row) and KPI(Second Row) to get the respective formula.
These 2 fields are actually coming from isolated inline tables.
I tried using the same If Else logic to get the values in Captions also, but its working in the captions(Strange)
 I hope it helps.
Thanks
Neelam
- Mark as New
- Bookmark
- Subscribe
- Mute
- Subscribe to RSS Feed
- Permalink
- Report Inappropriate Content
Hi,
Unfortunately, the same logic is not working in Captions
Thanks,
Neelam
- Mark as New
- Bookmark
- Subscribe
- Mute
- Subscribe to RSS Feed
- Permalink
- Report Inappropriate Content
Neelam,
Try to share a sample qvw here with small dummy data.
- Mark as New
- Bookmark
- Subscribe
- Mute
- Subscribe to RSS Feed
- Permalink
- Report Inappropriate Content
Hi Tresesco,
How are you? Long time!! Please ping your number over FB, will call you sometime. 
PFA the sample QV file.
Thanks,
Neelam
- Mark as New
- Bookmark
- Subscribe
- Mute
- Subscribe to RSS Feed
- Permalink
- Report Inappropriate Content
Hi,
I suppose, the label is expected to be one for an expression (which is fair). When you pull that expression to column in a pivot chart it appears to be mutiple columns while the internal representation is same - an expression. So, it doesn't actually take the dimension values into consideration in this label expression; hence it doesn't recognize them. I have tried an alternative (in the script), see if this helps. PFA.
- Mark as New
- Bookmark
- Subscribe
- Mute
- Subscribe to RSS Feed
- Permalink
- Report Inappropriate Content
Hi Tresesco,
Thanks for the suggestion, however it wont work in my scenario as the values will keep changing based on the selection. May be an alternate solution would be to create several columns which may not look visually good.
Thanks,
Neelam
- Mark as New
- Bookmark
- Subscribe
- Mute
- Subscribe to RSS Feed
- Permalink
- Report Inappropriate Content
Hi,
I guess, with proper structuring of _Time, _Metric2 and Exp fields in the script could take you to goal. And that would respond to your selection dynamically as well. But that's again tweaking your entire model.